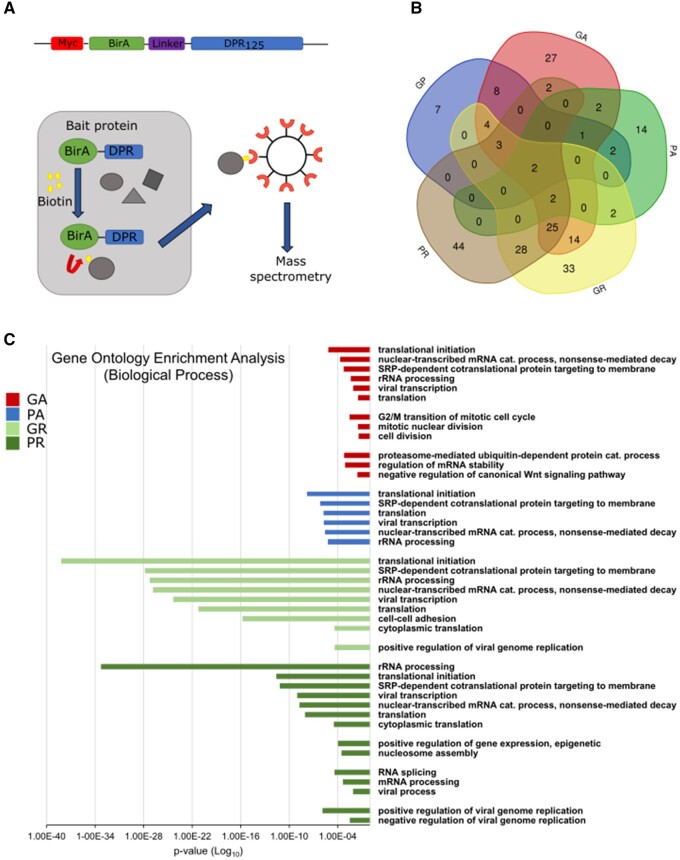
Figure 1.
Interactome of all five DPRs using BioID2 pull-down. (A) Schematic representation of constructs and pull-down experiments. The five DPR constructs consisted of 125 DPRs. (B) Venn diagram illustrating the overlap between the total interactors of the five DPRs after proteomic analysis, for Quant ratio versus control >2.0. The Venn diagram was prepared using the online tool provided by VIB and Ghent University (http://bioinformatics.psb.ugent.be/webtools/Venn/). (C) GO enrichment analysis for the interactors with Quant ratio versus BioID >2.0, showing the involvement of DPR interactors in different biological processes. There was no enrichment in the biological processes for polyGP interactors. P-values were derived via the DAVID algorithm.

