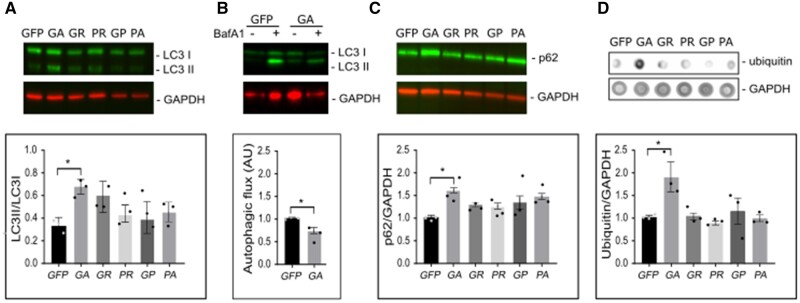
Figure 7.
Expression of polyGA results in accumulation of LC3, p62 and ubiquitin in HEK293 cells. HEK293 cells were transfected with the GFP-DPR constructs, and analysed 24 h later. (A) Representative immunoblotting showing higher ratio between LC3 II and LC3 I in samples expressing polyGA. Bottom, quantification of immunoblotting. (B) Representative immunoblotting showing lower autophagic flux in cells expressing polyGA. Bottom: Quantification of immunoblotting. (C) Representative immunoblotting showing levels of p62. Bottom: Quantification of immunoblotting. (D) Representative dot blot for levels of ubiquitin. Bottom: Quantification of dot blots. Quantification data are means ± SEM (n = 3 biological repeats). *P ˂ 0.05 (B: unpaired t-tests, A, C and D: one-way ANOVA with Dunnett’s multiple comparisons test). Baf A1 = bafilomycin A1.

