
Fig. 3.
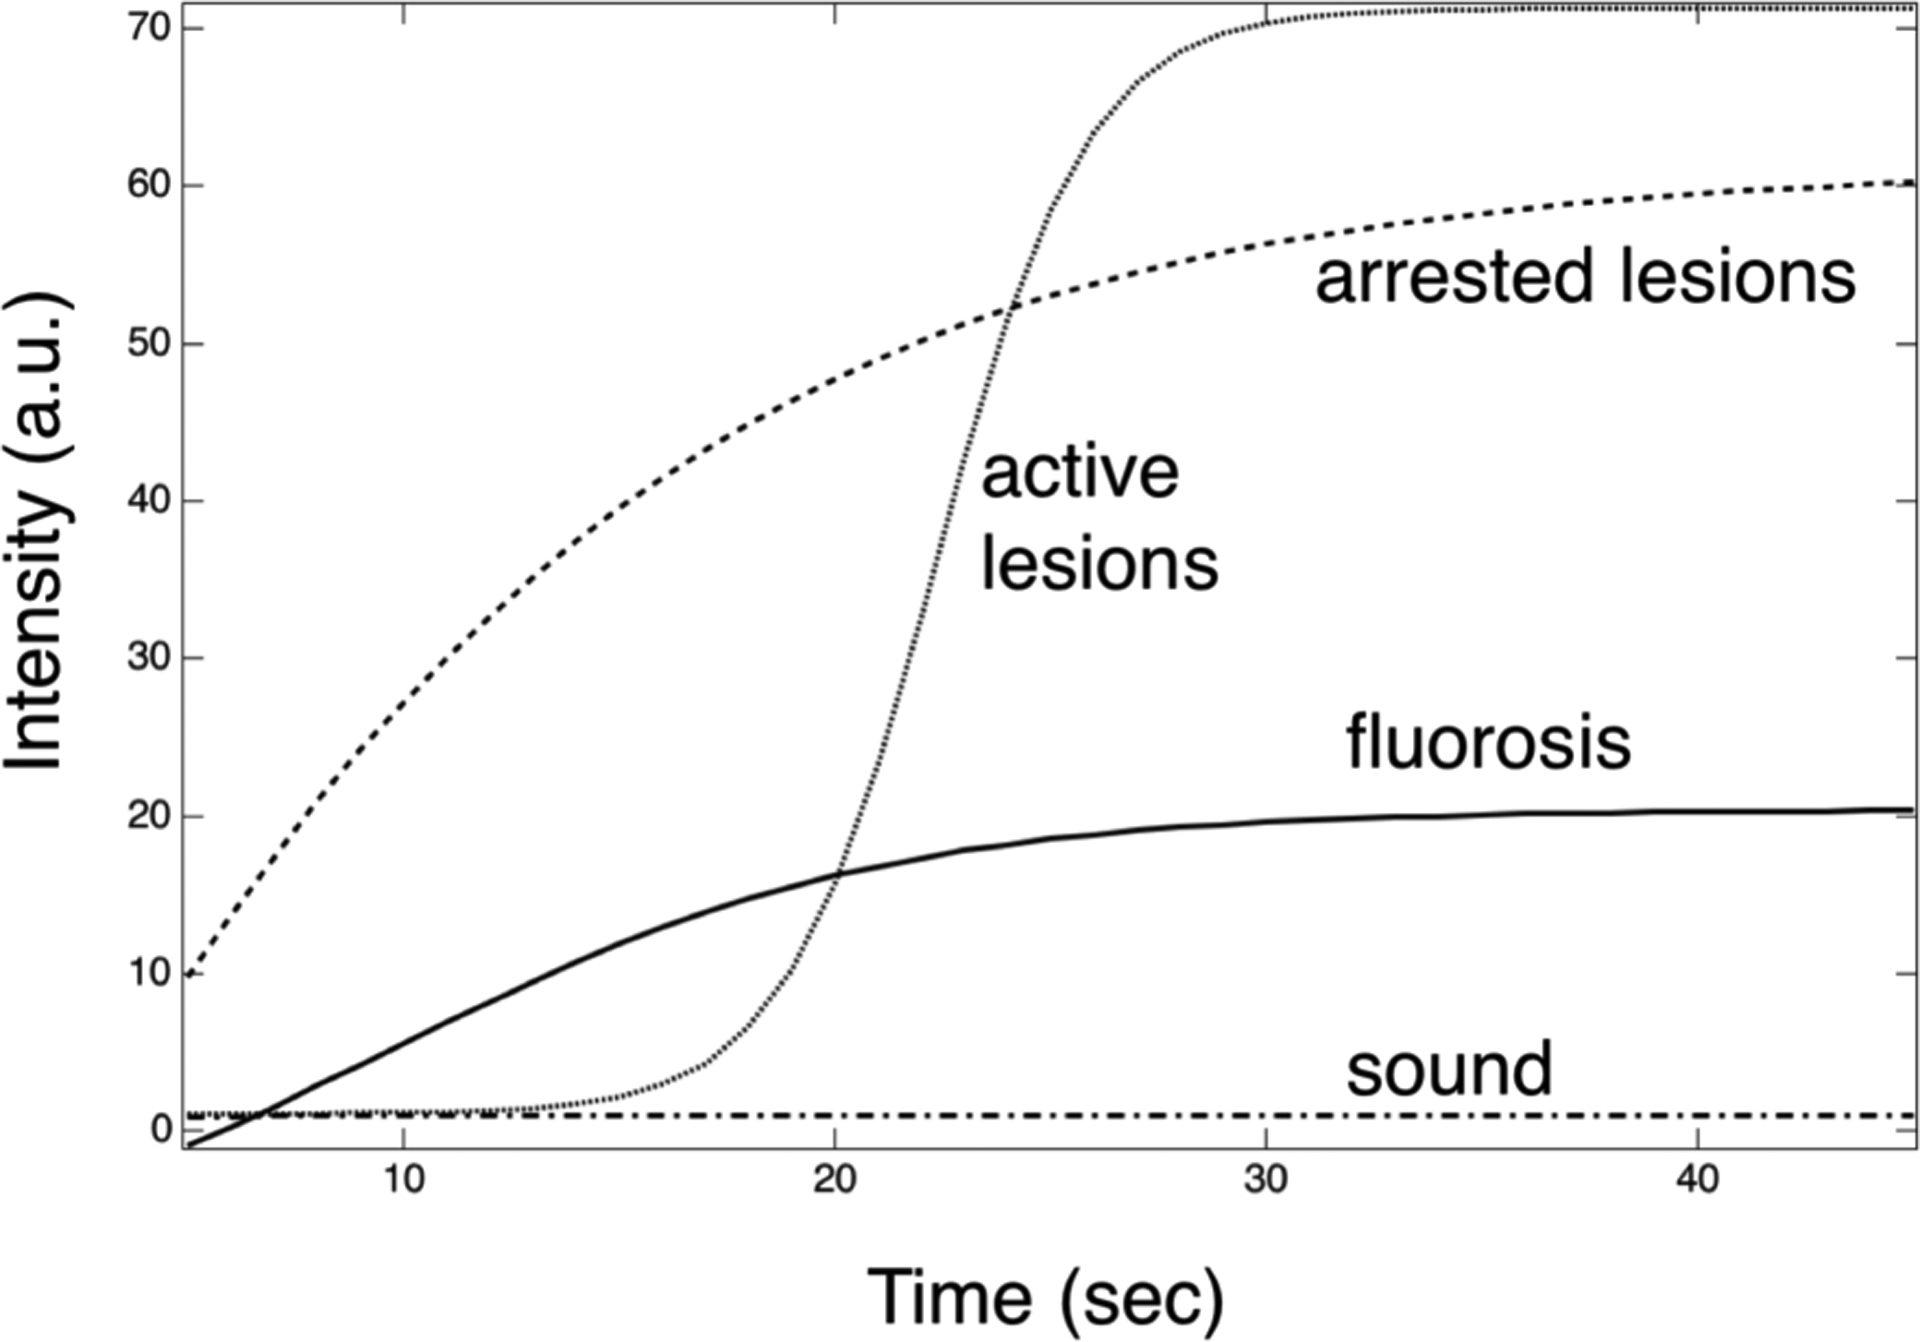
Mean intensity vs time curves plotted for sound, active and arrested lesions (Ref 33) and the areas of fluorosis during dehydration at 1950 nm for the 16 samples from this study.
Official websites use .gov
A
.gov website belongs to an official
government organization in the United States.
Secure .gov websites use HTTPS
A lock (
) or https:// means you've safely
connected to the .gov website. Share sensitive
information only on official, secure websites.
Mean intensity vs time curves plotted for sound, active and arrested lesions (Ref 33) and the areas of fluorosis during dehydration at 1950 nm for the 16 samples from this study.