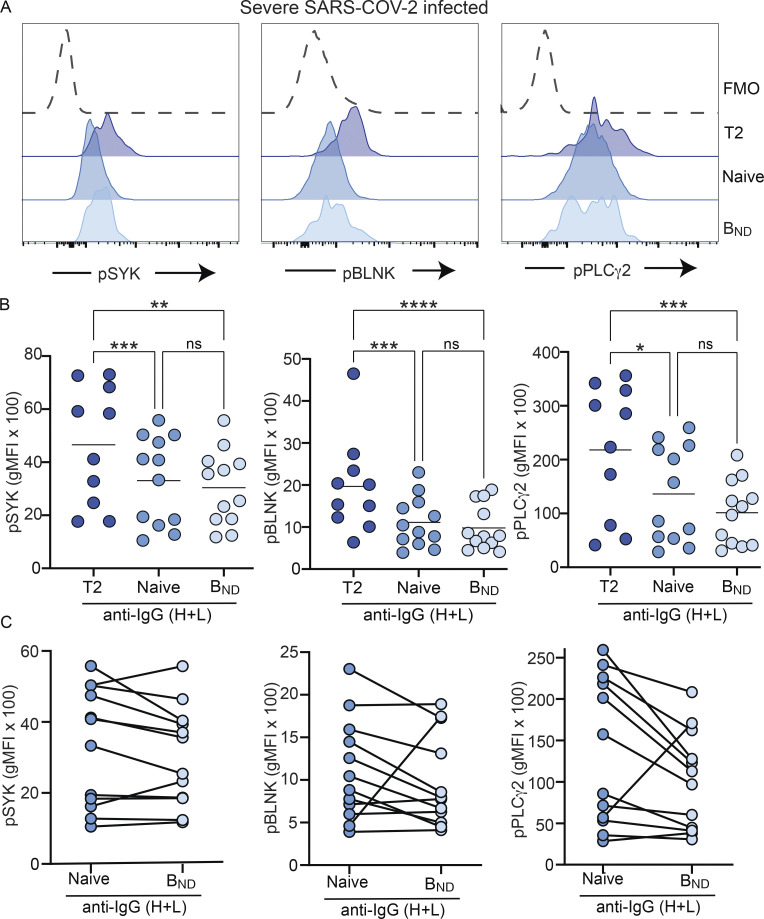
Figure 5.
BND cells from individuals with severe SARS-CoV-2 infection have a BCR signaling capacity similar to Naive B cells. (A) Expression (geometric mean fluorescent intensity) of pSYK Y348, pBLNK Y84, or pPLCγ2 Y759 in BND cells (light blue) as compared with transitional T2 (royal blue), and Naive B cells (medium blue) from severe SARS-CoV-2 infection (n = 12) after 10 μg/ml anti-IgG (H + L) F(ab’)2 treatment for 5 min shown as representative histogram. The control histogram (dashed line) is a BND FMO from healthy controls. (B) Quantification of pSYK, pBLNK, and pPLCγ2 after BCR stimulation in T2, Naive, or BND cells. (C) Pairwise matching of Naive and BND cells from severe SARS-CoV-2 infection (n = 12). Statistics: one-way ANOVA or paired t test; *, P < 0.05; **, P < 0.01; ***, P < 0.001; ****, P < 0.0001.

