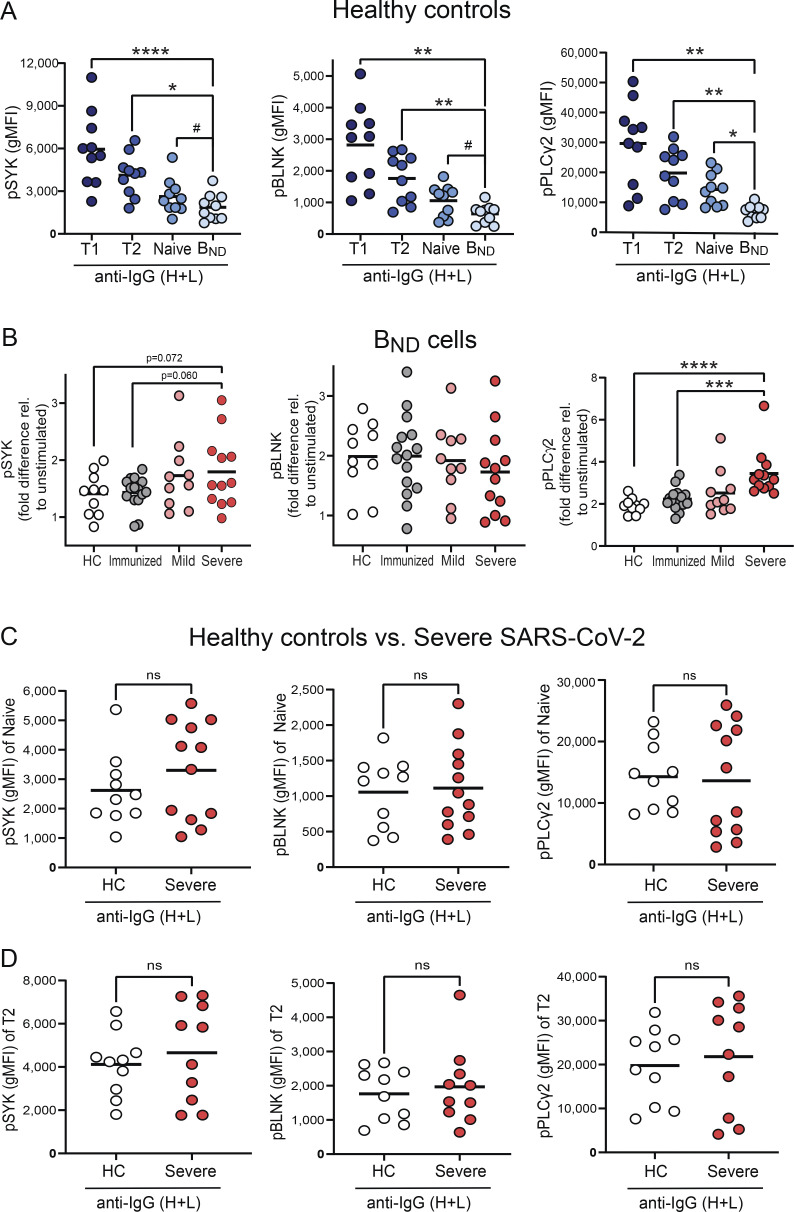
Figure S4.
BND cells have reduced BCR signaling in healthy controls and Naive/T2 B cells from healthy controls and severe SARS-CoV-2 infection have comparable levels of BCR signaling. (A) Expression (geometric mean fluorescent intensity) of pSYK Y348, pBLNK Y84, and pPLCγ2 Y759 in Transitional T1, T2, Naive, or BND cells from healthy controls (n = 10) after 5-min incubation with anti-IgG (H + L) F(ab’)2. (B) Fold difference between expression level of pSYK, pBLNK, and pPLCγ2 from unstimulated BND cells and stimulation with anti-IgG (H + L) F(ab’)2 for 5 min in each patient population from healthy controls (n = 10), those immunized against SARS-CoV-2 (n = 15) or those with mild (n = 10) or severe SARS-CoV-2 infection (n = 12). (C and D) Expression (geometric mean fluorescent intensity) of pSYK Y348, pBLNK Y84, and pPLCγ2 Y759 in Naive B cells (C) or T2 cells (D) from healthy controls (n = 10) and severe SARS-CoV-2 infection (n = 10) after 5-min incubation with anti-IgG (H + L) F(ab’)2. Statistics: one-way ANOVA or unpaired t test; #, P = 0.06; *, P < 0.05; **, P < 0.01; ***, P < 0.001; ****, P < 0.0001.

