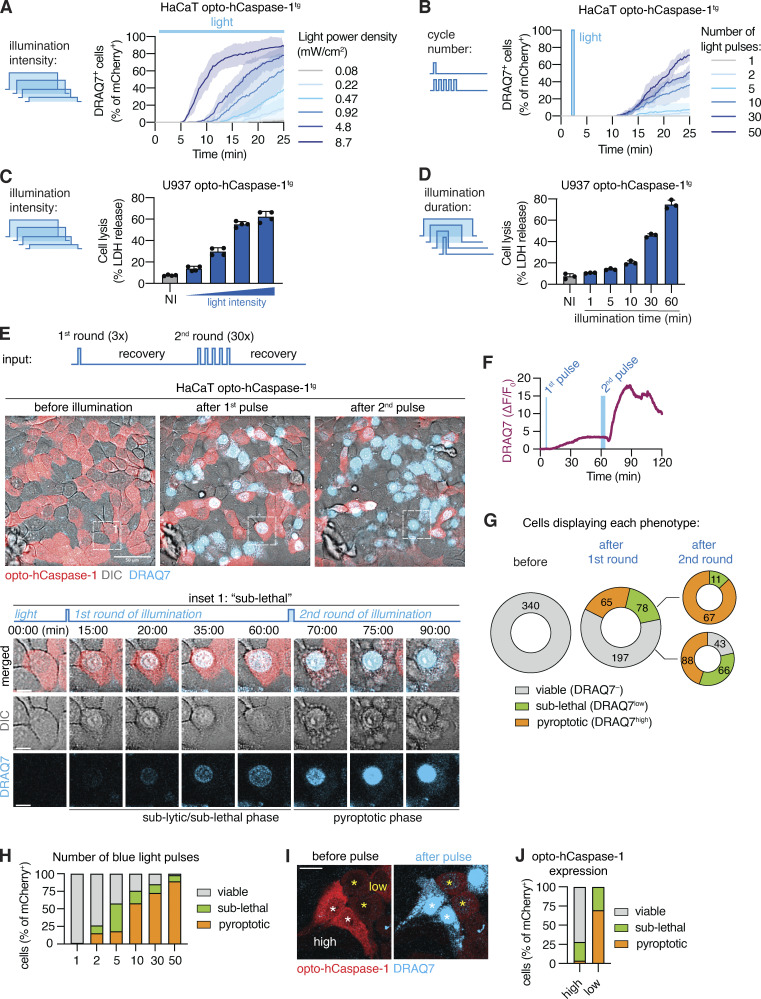
Figure 3.
Titrating illumination dose allows for sub-lethal opto-hCaspase-1 activation. (A and B) Percentage of DRAQ7-positive nuclei in opto-hCaspase-1tg HaCaT cells illuminated with (A) varying intensity blue light every 15 min, or (B) transiently illuminated at t = 3 min with an increasing number of light pulses (0.2 mW/cm2/pulse). Mean ± SEM, representative of three independent experiments, each done with triplicate technical replicates (n = 9). (C and D) LDH release from PMA-differentiated opto-hCaspase-1tg U937 cells illuminated either (C) continuously with different intensity light (0.1–4 mW/cm2) or (D) with a defined light intensity (0.9 mW/cm2). Representative of three independent experiments, each done with triplicate (C) or quadruplicate (D) technical replicates (n = 9, n = 12), mean ± SD. (E–J) Opto-hCaspase-1tg HaCaT cells were subjected to a first round of low-intensity (3 × 0.2 mW/cm2) blue light illumination and left to recover for 60 min, followed by a second round of illumination (variable number × 0.2 mW/cm2). (E) Representative confocal images before , after first (t = 60 min), and after second (t = 120 min) round of illumination. Inset shows cell undergoing sub-lethal membrane permeabilization and reversion after first pulse and complete pyroptosis after second pulse. Scale bar: 50 µm; inset scale bar, 10 µm. (F) Normalized nuclear DRAQ7 intensity of the cell from inset in E. (G) Quantification of the cells according to phenotypes before and after illumination. Cells were classified as: “viable” = no DRAQ7 influx and normal morphology; “sub-lethal” = low DRAQ7 influx, early pyroptotic features (nuclear rounding, membrane blebbing) but reversion to normal morphology within 15–30 min; “pyroptotic” – high DRAQ7, pyroptotic morphology. (H) Percentage of viable, sub-lethal and pyroptotic cells depending on the initial number of light pulses (t = 30 min after illumination). (I) Images of cells with high (white *) and low (yellow *) opto-hCaspase-1 expression before and after pulsed illumination, respectively. Scale bar, 20 µm. (J) Percentage of cells with high or low optoCaspase-1 expression displaying each phenotype after a transient low-intensity blue light stimulation. (E–J) Data are representative of six independent experiments or pooled from six independent experiments (n = 340 cells in total).

