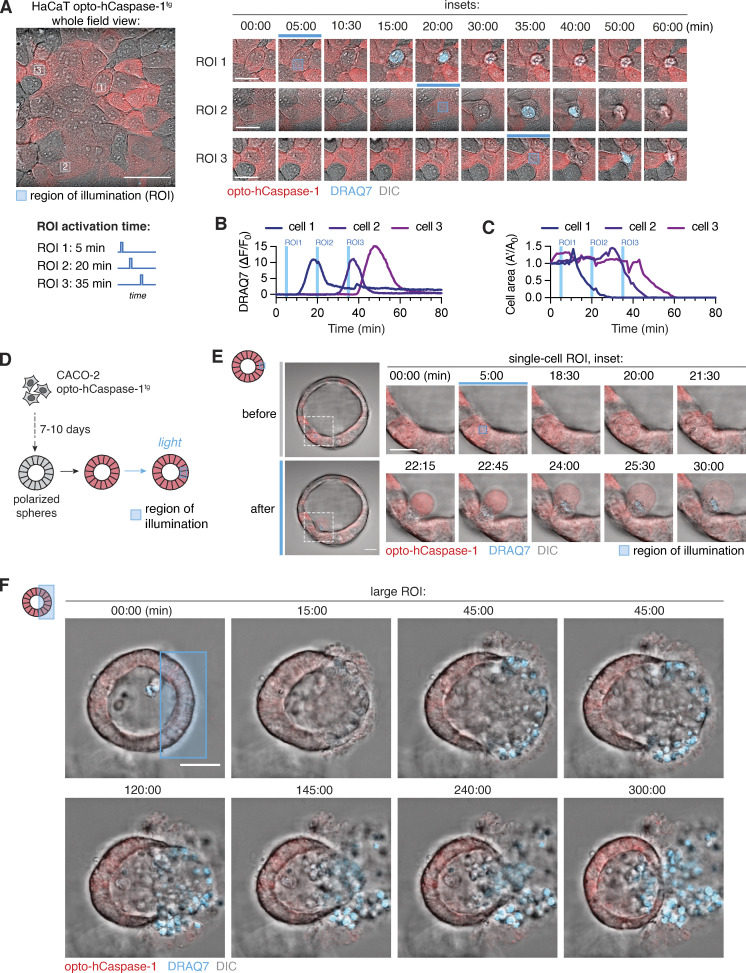
Figure 4.
Optogenetic single-cell ablation in 2D and 3D cell cultures. (A) Time-lapse images of single-cell ablation in confluent monolayer of opto-hCaspase-1tg HaCaT cells. Left, whole field of view. Right, inset images of three selectively ablated cells; illuminated at 5, 20, and 35 min. Blue squares indicate the regions of interest (ROI) which were stimulated with blue light. DRAQ7 = membrane permeabilization. Scale bar, 50 µm; inset scale bar, 20 µm. (B and C) Normalized DRAQ7 intensity (B) and loss of cell area (C). Blue lines indicate timing of ROI stimulation for each cell. (D) Schematic representation of experimental setup for spatially resolved cell ablation in 3D Caco-2 spheres. (E and F) Time-lapse images showing selective ablation of a single cell (E) or large group of cells (F) in Caco-2 spheres. ROIs (blue square) were stimulated with blue light (3.4 mW/cm2) at t = 5 min, and pyroptosis measured by DRAQ7 influx. Data are representative of n = 5 (A and B), 7 (D), and 4 (E) independent experiments. Scale bars, 50 µm; inset scale bar (E), 20 µm.

