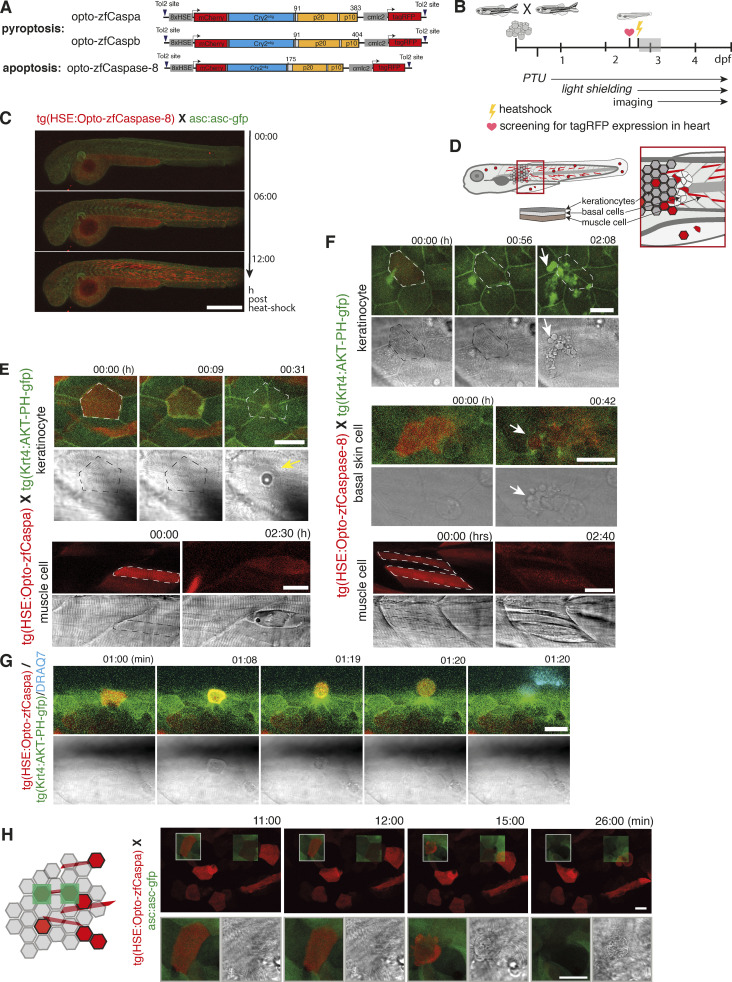
Figure 7.
Spatial and temporal control of PCD by opto-caspases in zebrafish. (A) Construct design for heat-shock-induced expression of mCherry-Cry2olig fusion with zfCaspa, zfCaspb, or zfCaspase-8. (B) Experimental setup for expression, activation, and imaging of optogenetic induction of PCD. Grey shaded region is the time frame in which C was acquired. (C) Time-lapse imaging of 2,5-dpf Tg(Opto-zfCaspa)×asc:asc-gfp larvae at 0, 6, and 12 hphs (hours post heat shock). Scale bar, 500 µm. (D) Schematic depiction of a zebrafish larvae showing the location of keratinocytes, basal cells and muscle cells. (E–H) The timecourse of light-induced activation of Caspa or Caspase-8 in Tg(Opto-zf-Caspa) or Tg(Opto-Caspase-8) lines crossed with tg(Krt4:AKT-PH-GFP). Dying cells are outlined by dashed lines. Scale bar, 20 µm. (E) Keratinocyte pyroptosis and muscle cell death after activation of opto-zfCaspa. (F) Keratinocyte, basal cell and muscle cells death after activation of opto-zfCaspase-8. (G) Keratinocyte extrusion after activation of opto-zfCaspa. (H) Two photon-activation of opto-zfCaspa (red) in single cells. Data are representative of n = 3 independent repeats.

