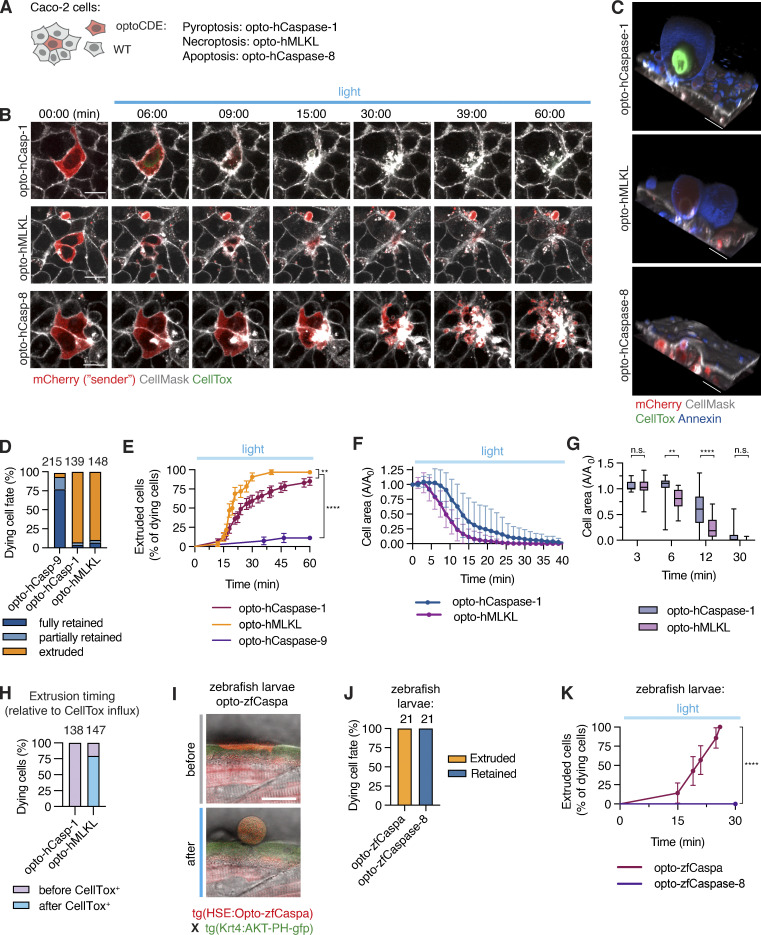
Figure 8.
Response of neighboring cells to PCD. (A) Co-culture system consisting of Caco-2 cells expressing mCherry-tagged optoCDEs and 50× excess of WT Caco-2 neighbors. (B–H) Clusters of one or several optoCDE-expressing cells surrounded by WT cells were stimulated with 488 nm light (8.7 mW/cm2) every 180 s for 90 min of total time. (B) Timelapse images showing cell boundaries (CellMask) and membrane permeabilization (CellTox). (C) 3D reconstructions showing extruded pyroptotic and necroptotic cells (top and middle panels) or efferocytosed apoptotic bodies (bottom panel) at 1 h. Annexin V labels necrotic cell membranes. (D) Quantification of dying cell fates as described in the material and method section. Total number of cells quantified per condition is indicated. (E) Pyroptotic, necroptotic and apoptotic cell extrusion over time. n = 56, 32, and 27 cells. **, P < 0.01; ****, P < 0.0001 (Mantel-Cox test). (F and G) Decrease in pyroptotic and necroptotic cell area over time (normalized to t = 0). Mean n = 20 and 18 cells. *, P < 0.05; **, P < 0.01 (two-tailed t test). (H) Percentage of pyroptotic and necroptotic cells fully extruded before or after gain of CellTox signal. (I) Images of opto-zfCaspa-expressing zebrafish keratinocytes before and after illumination (488 nm). (J) Quantification of extruded versus retained cells during opto-zfCaspa-induced pyroptosis and opto-zfCaspase-8-induced apoptosis in zebrafish larvae. (K) Analysis of pyroptotic and apoptotic cell extrusion in zebrafish larvae. n = 21 events for each type of cell death; ****, P < 0.0001 (Mantel-Cox test). Mean ± SD (F and G) or mean ± SEM (E and K). Data are representative (B, C, and I) or pooled from (D–H and J–K) of three independent experiments, each done with triplicate technical replicates (n = 9). Scale bars, 20 µm.

