Figure 9.
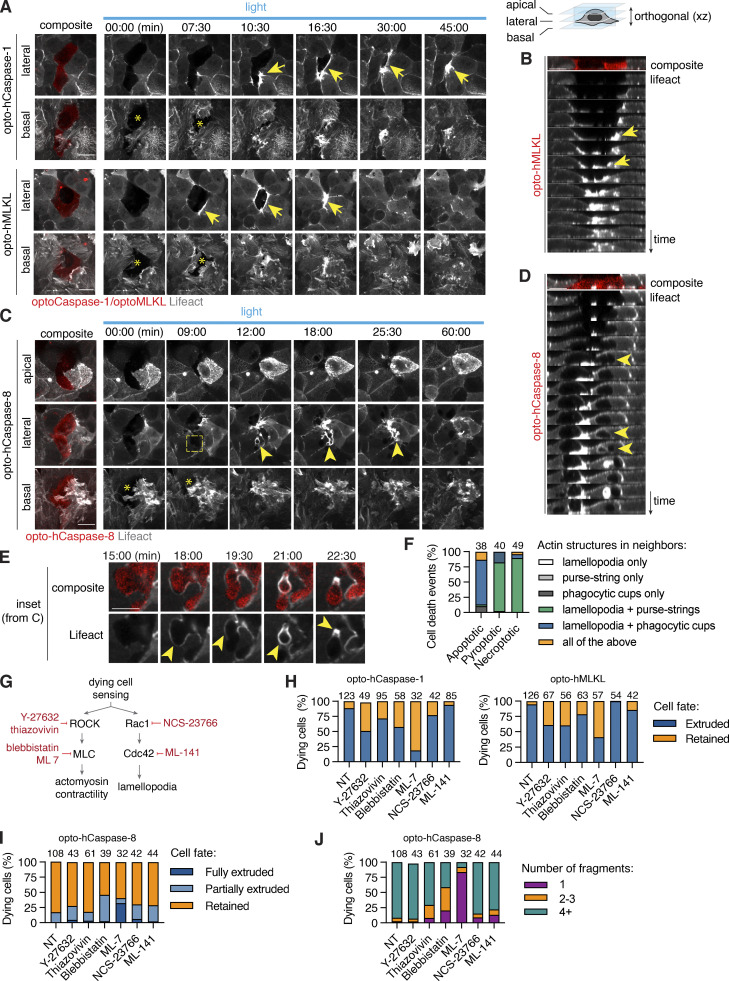
Necrotic cell extrusion and apoptotic cell efferocytosis require differential cytoskeletal rearrangement in neighbors. (A–D) Time-lapse images and reconstructed side-views showing actin dynamics in neighboring cells during pyroptotic and necroptotic Caco-2 cell extrusion, or apoptotic Caco-2 cell engulfment. (A and B) White arrows indicate lamellipodia at the basal (0 µm) plane, yellow arrows show actin cables at the medial (+5 µm) plane. Photostimulation (2 mW/cm2) and z-stack acquisition were performed every 90 s. (C and D) Images show apical closure (apical plane), efferocytic cup-like structure formation (medial plane, yellow arrows) and lamellopodia (basal plane) around apoptotic cell. Apical plane is the maximum intensity projection of four planes acquired at 0.6 µm intervals. Data are representative of at least n = 3 independent experiments. (E) Inset images from C showing actin polymerization in neighbors during apoptotic corpse fragmentation and uptake. (F) Quantification of actin structures formed in neighboring cells in response to different types of cell death. Numbers indicate cell death events per conditions, pooled from three independent experiments. (G) Major regulators of actin remodeling during lamellipodia and purse-string formation, and inhibitors targeting them. (H–J) Quantification of pyroptotic, necroptotic and apoptotic cell extrusion (at t = 60 min) and apoptotic cell fragmentation in co-cultures treated with the different cytoskeletal inhibitors, pooled from six independent experiments (n as indicated). Cells were photostimulated with blue light 8.7 mW/cm2 every 180 s to activate optoCDEs. Scale bars, 20 µm.

