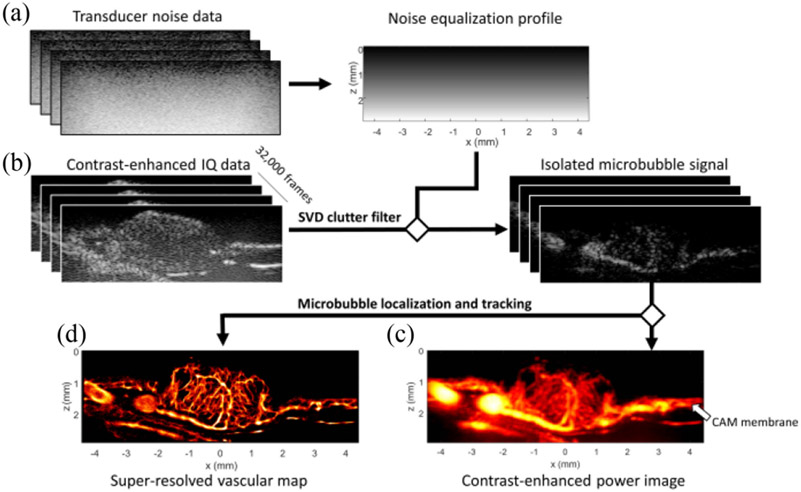
Fig. 2.
ULM acquisition and processing pipeline. A) A reference transducer acquisition was used to estimate a noise equalization profile to correct for depth dependent attenuation. B) A total of 32000 contrast-enhanced IQ data frames were acquired and SVD filtered to generate isolated microbubble data and C) contrast-enhanced power Doppler images. The isolated microbubble data then went into the ULM processing pipeline, which included microbubble separation, microbubble localization, and microbubble pairing and tracking. D) The final super-resolved images were used to quantify the treatment effect in each CAM tumor therapy group.

