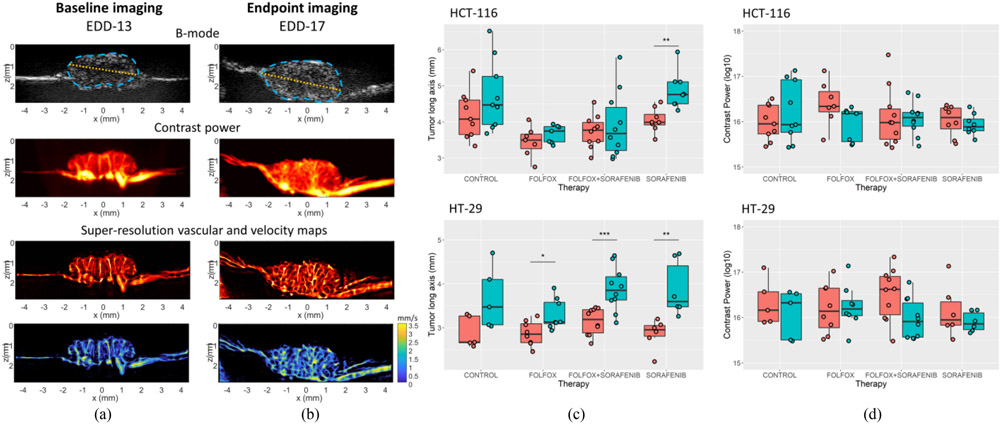
Fig. 3.
Longitudinal changes in CAM tumors. A) Representative baseline contrast-enhanced power Doppler and super-resolution ULM images of CAM engrafted tumors. B) This same control tumor at endpoint imaging, which demonstrates both the growth of the tumor diameter and the continued development of intratumor vascularization over the course of the study. Tumor outlines and maximal diameter are demonstrated as cyan and orange lines on the B-mode image, respectively. C) Quantification of the tumor long-axis which reveals a general trend of tumor growth for all treatment groups in this study. D) Quantification of the contrast power of the tumor cross-sectional area.

