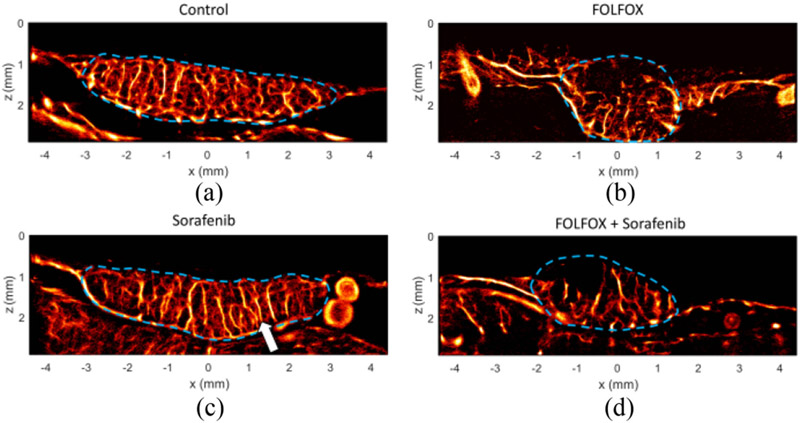
Fig. 4.
Super-resolution images of treatment effect. A) Endpoint (EDD-17) control ULM images reveal a dense microvascular network throughout the tumor mass. B) In comparison to the control tumors, the sorafenib treated tumors exhibited slight vascular pruning of microvessels, with a more columnar appearance in vascular network structure (arrow). C) Chemotherapy treated tumors displayed avascular tumor regions, implying a more aggressive vascular pruning. D) Combination treated tumors also exhibit avascular tumor regions.

