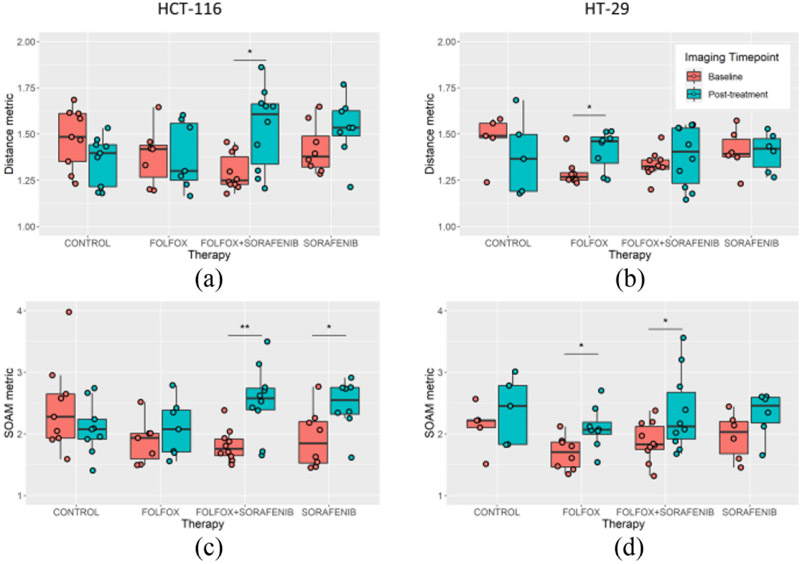
Fig. 8.
Measures of vascular tortuosity. Vascular tortuosity was measured using the distance metric (DM) and the sum of angle metric (SOAM). For the HCT-116 cell line, the A) DM was found to significantly increase in the combination therapy group and B) SOAM measures were found to significantly increase in both sorafenib containing therapies. The HT-29 cell line showed C) a significantly increased DM for FOLFOX treated tumors, and D) increased SOAM in the FOLFOX and combination therapy treated groups.

