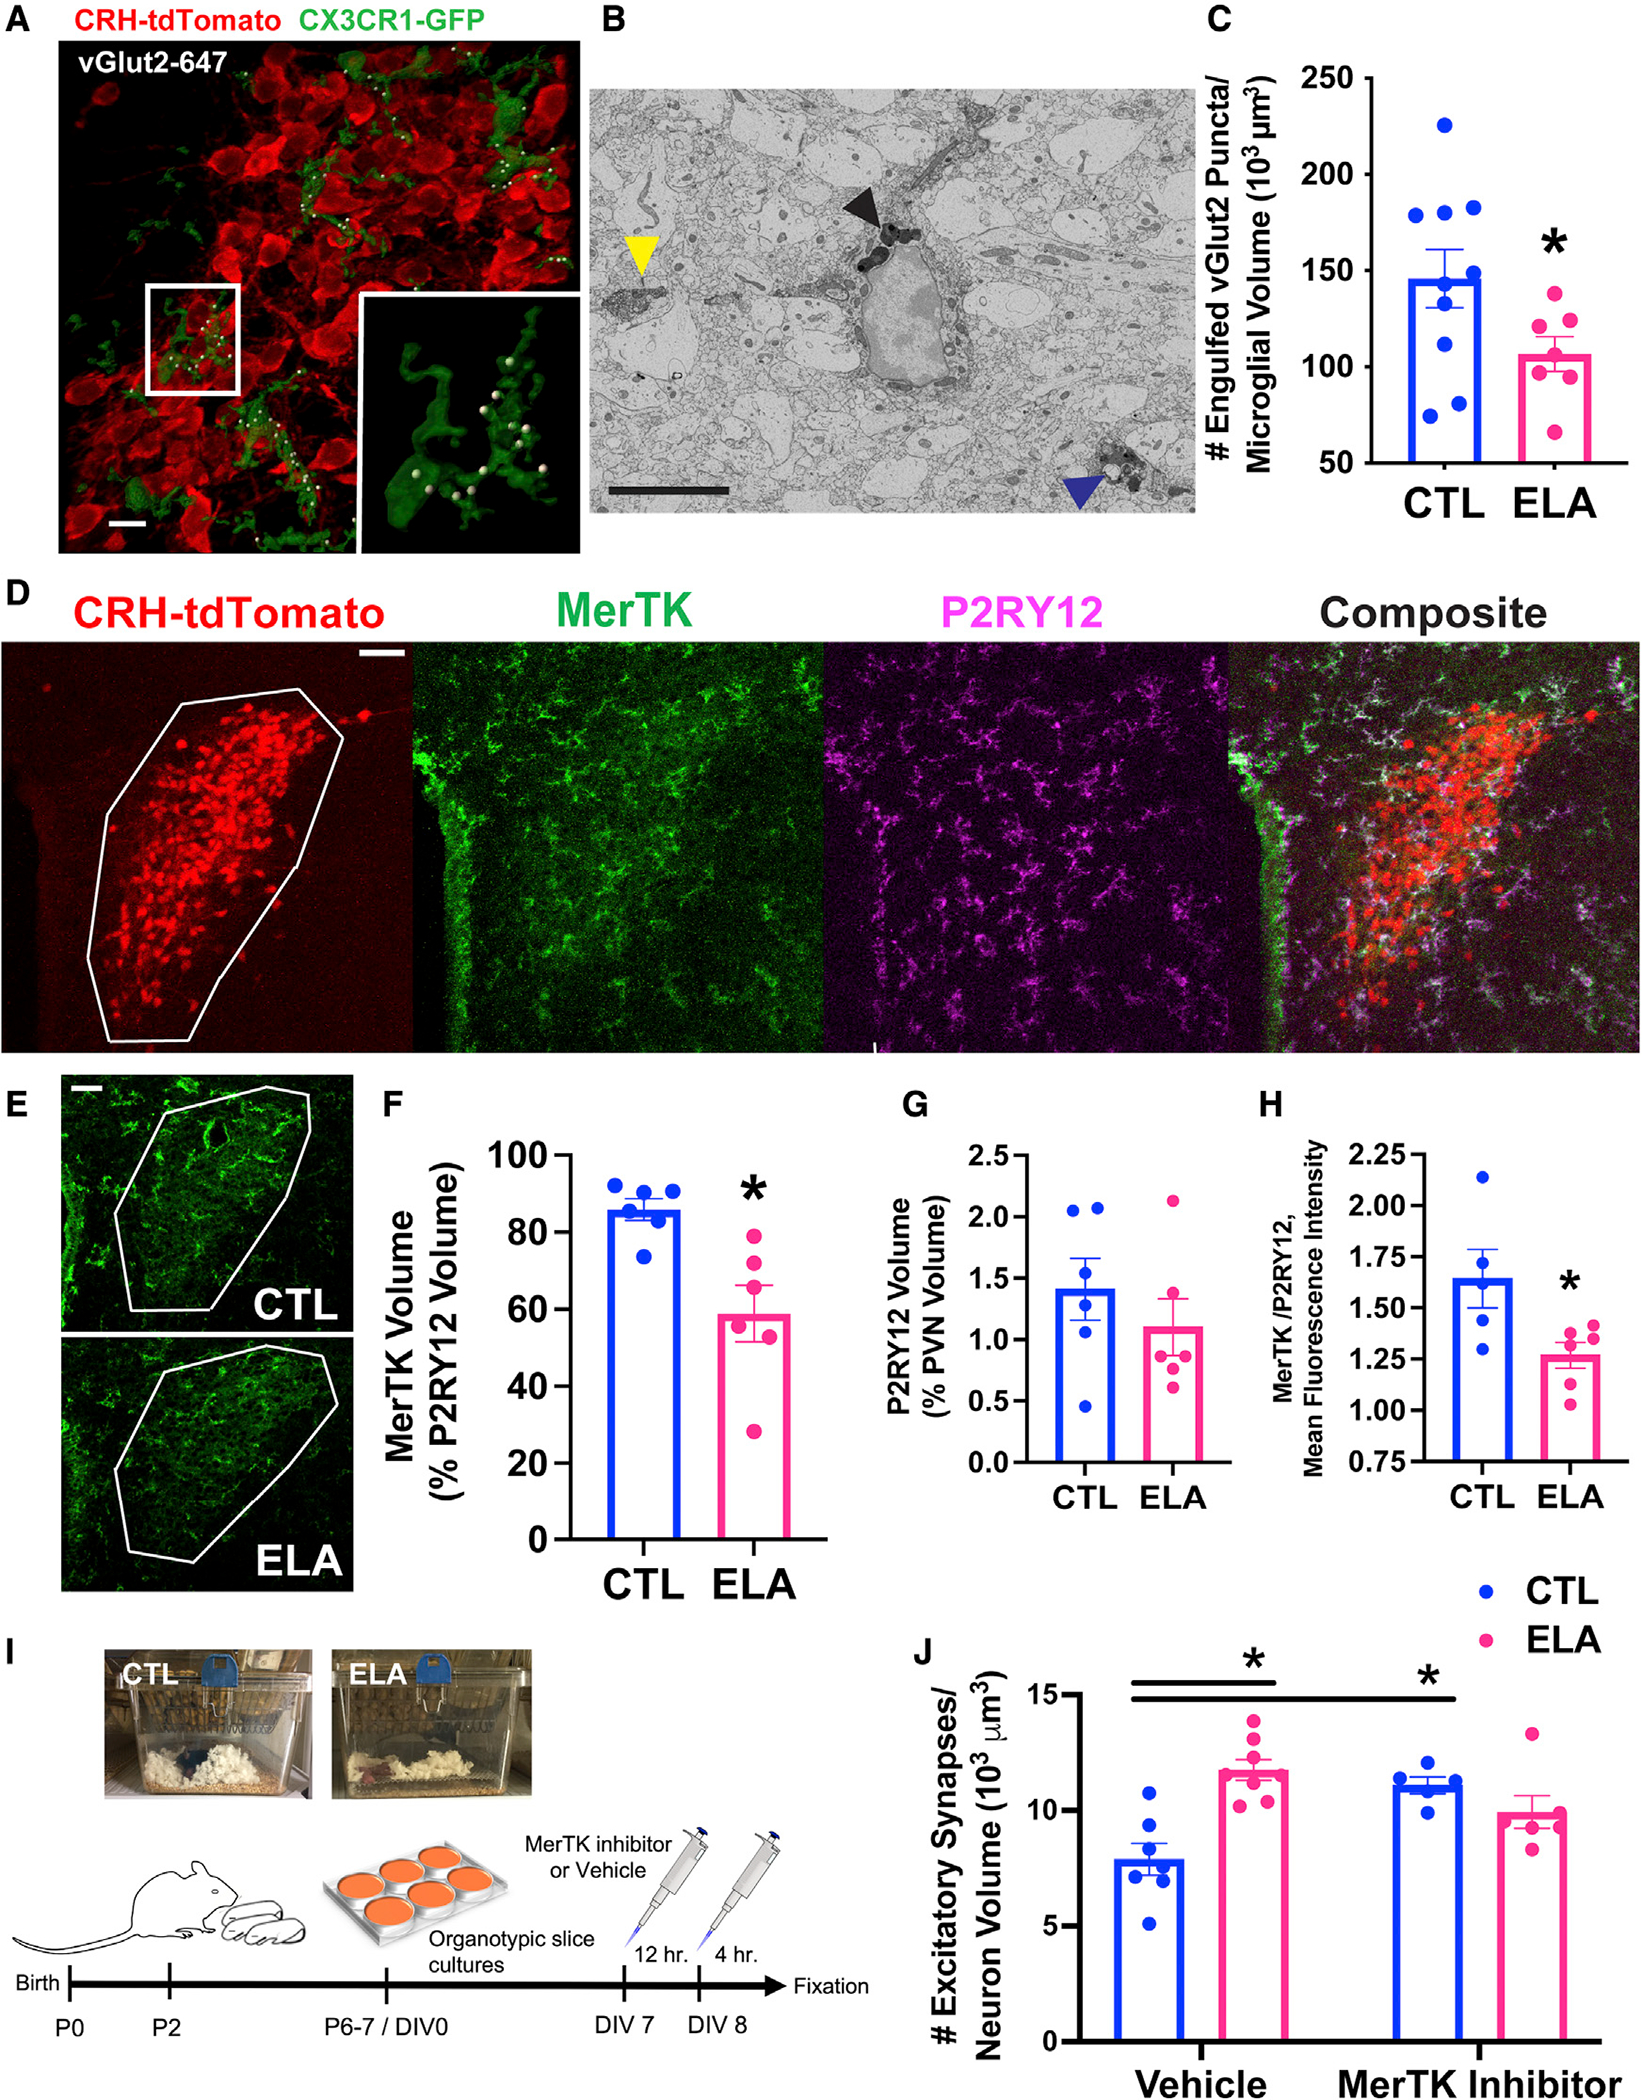
Figure 3. Microglial mechanisms for augmented excitatory synapses on CRH+ cells in ELA mice.

(A) Representative confocal image of microglia (green; CX3CR1-GFP) abutting CRH+ neurons (red; CRH-tdTomato), engulfing vGlut2+ excitatory presynaptic puncta (white; vGlut2 puncta identified as inside microglia by Imaris 3D reconstruction) in mpd PVN of a P8 male mouse. Scale bar, 10 μm (raw images in Figures S2C–S2E).
(B) Representative electron micrograph of a microglia labeled with ionized calcium binding adaptor molecule (Iba)1 and 3′,3-diaminobenzidine (DAB; electron-dense soma and processes) in P8 PVN. The yellow arrowhead points to the postsynaptic density of an excitatory synapse directly abutting a labeled microglial process. The black arrowhead indicates multiple lysosomes (electron dense) in microglial soma; these degrade engulfed material. The blue arrowhead points to an engulfed endosome of synaptic elements, including a putative postsynaptic density, surrounded by lysosomes in a microglia process. Scale bar, 5 μm.
(C) ELA reduces the number of vGlut2+ synaptic puncta engulfed by microglia abutting CRH+ neurons in the P8 mpd PVN of male mice (t13.87 = 2.22, p = 0.04; Welch’s t test; see Figure S5C for female data), as quantified in confocal 3D reconstructions.
(D) Representative confocal image of the microglial phagocytic receptor Mer tyrosine kinase (MerTK) expression. MerTK is primarily in microglia in the P8 PVN (white ROI; see also Figure S3D). Red = CRH-tdTomato+ neurons; green = MerTK immunoreactivity (IR); magenta = P2RY12 IR (microglia); white = overlap of green and magenta in composite image. Scale bar, 50 μm.
(E) Representative confocal images of MerTK IR in CTL (top) compared to ELA (bottom) P8 PVN (white ROI). Scale bar, 50 μm.
(F) MerTK volume per unit volume of P2RY12+ microglia (measured using Imaris) was lower in P8 ELA male PVN than in controls (t6.46 = 3.44, p = 0.01; Welch’s t test).
(G) Notably, P2RY12 volume and its percentage of PVN volume did not differ in ELA compared to control mice.
(H) The ratio of MerTK mean fluorescence intensity (MFI; measured using Imaris) to P2RY12 MFI was significantly reduced in ELA mice PVN (t9 = 2.54, p = 0.03; unpaired t test).
(I) Schematic of the MerTK inhibition experiment: Litters of CRH-tdTomato+ mice were randomly assigned to CTL or ELA conditions on P2. On P6–7, organotypic hypothalamic slice cultures were prepared and maintained for 7 d in vitro (DIV). On DIV7, cultures were treated with 20 nM of a small-molecule MerTK inhibitor (UNC2025: ~40-fold greater selectivity for MerTK over the Axl and Tyro3 TAM receptors [McDaniel et al., 2018; Zhang et al., 2014a]) or vehicle. Twelve hours later, the medium was refreshed with new drug, and the cultures were fixed 4 h later (Figure S3E).
(J) MerTK inhibition increased the number of excitatory synapses on CRH+ neurons in PVN cultures from control mice but not in ELA mice (significant interaction of ELA × drug, F1,22 = 17.89, p = 0.0003; 2-way ANOVA; p < 0.05; post hoc Tukey’s test).
Means ± SEMs; *p < 0.05.
