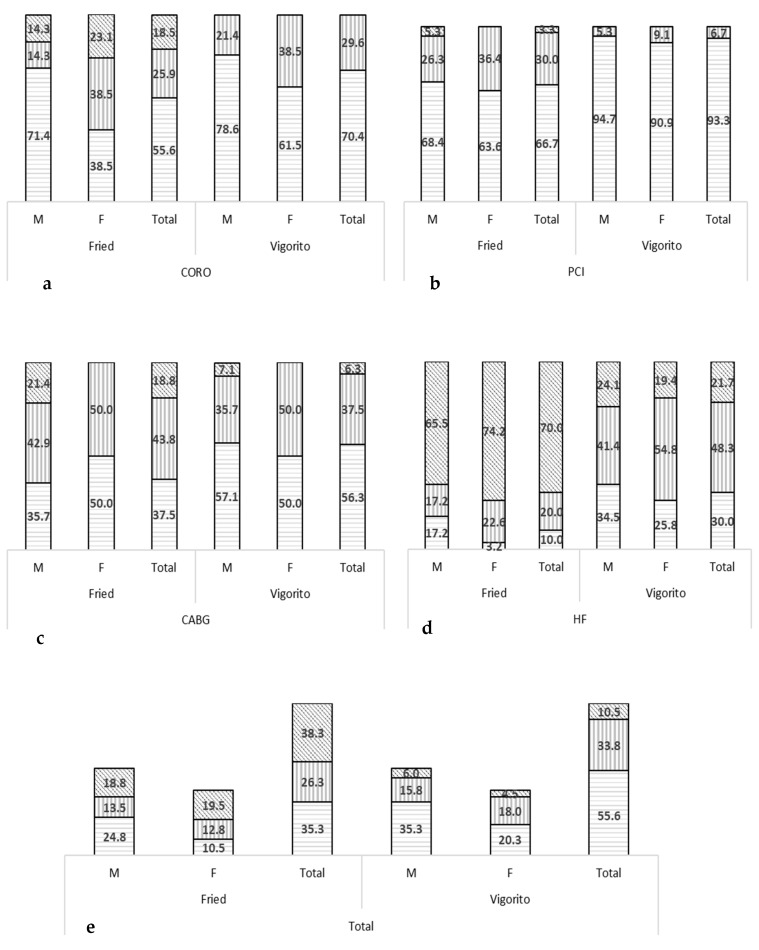
Figure 1.
Distribution of the different levels of frailty (%) according to Fried and Vigorito for male and female CORO (a), PCI (b), CABG (c) and HF (d) patients. The different levels of frailty are represented as no frailty (horizontal lines), pre-frailty (Fried) or mild frailty (Vigorito) (vertical lines) and frailty (Fried) or moderate frailty (Vigorito) (diagonal lines). Note: Severe frailty (Vigorito) was not detected in the subjects and, thus, are not represented in the figure. Results are expressed as % within males and within females per CVD for each subcategory of frailty (in CORO, PCI, CABG and HF patients) or as % within CVD for total results (in CORO, PCI, CABG and HF patients) or as % within total population (for total results in last graph) (e). CABG, coronary artery bypass grafting; CORO, coronarography; F, females; HF, heart failure; M, males; PCI, percutaneous coronary intervention.

