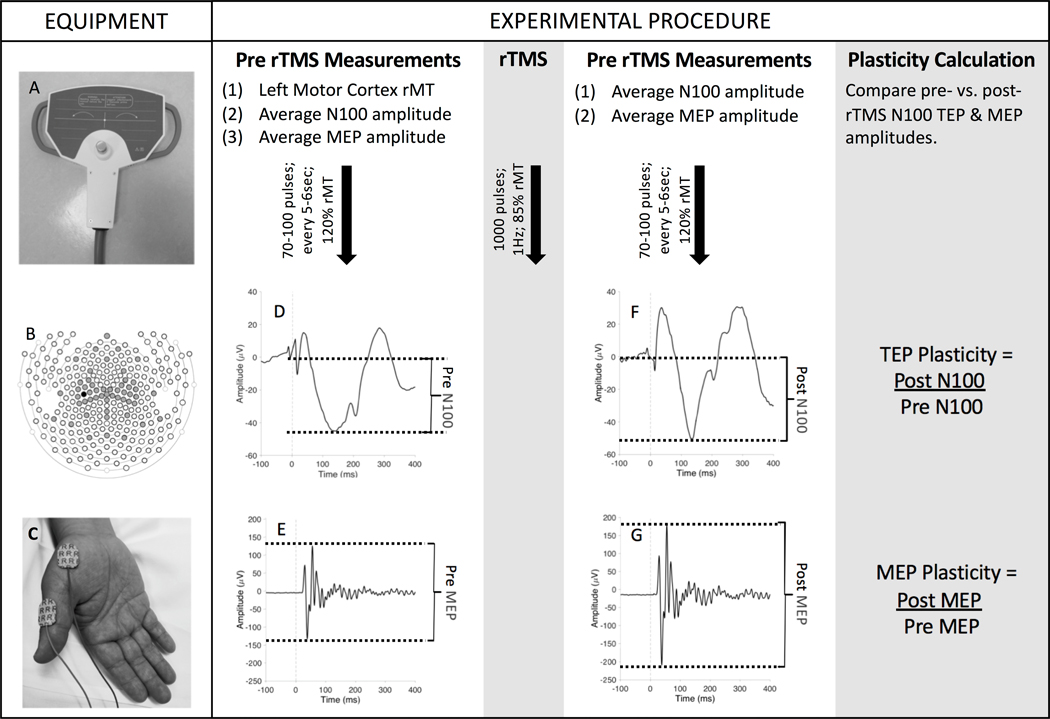
Figure 1. Summary of TMS-EMG-EEG Methodology:
EQUIPMENT: (A) Subjects received TMS to the left motor cortex using a 70mm butterfly coil. (B) A 257-lead EGI cap was placed and paste was applied to the 48 electrodes illustrated in gray (standard 10–20 montage plus additional central coverage); the TMS-EEG Evoked Potential (TEP) of interest (the N100 amplitude) was measured at the C3 electrode (black circle). (C) Motor evoked potentials (MEPs) were recorded from the right abductor pollicis brevis. EXPERIMENTAL PROCEDURE: Before repetitive TMS (rTMS), a resting motor threshold (rMT) was established. Subjects then received 70–100 single pulses of TMS to the left motor cortex. Resulting (D) N100 TEPs and (E) MEPs were grand averaged across all trials and the amplitude of this averaged waveform was calculated (baseline-to-peak for TEPs; peak-to-peak for MEPs). Baseline excitability was quantified by the rMT and pre-rTMS N100 TEP amplitude. Next, rTMS was administered to the left motor cortex. After rTMS administration, subjects again received 70–100 single pulses of TMS, and mean (F) N100 TEP and (G) MEP amplitudes were derived. Cortical plasticity was measured by calculating the ratio of post-rTMS to pre-rTMS TEP and MEP amplitudes.

