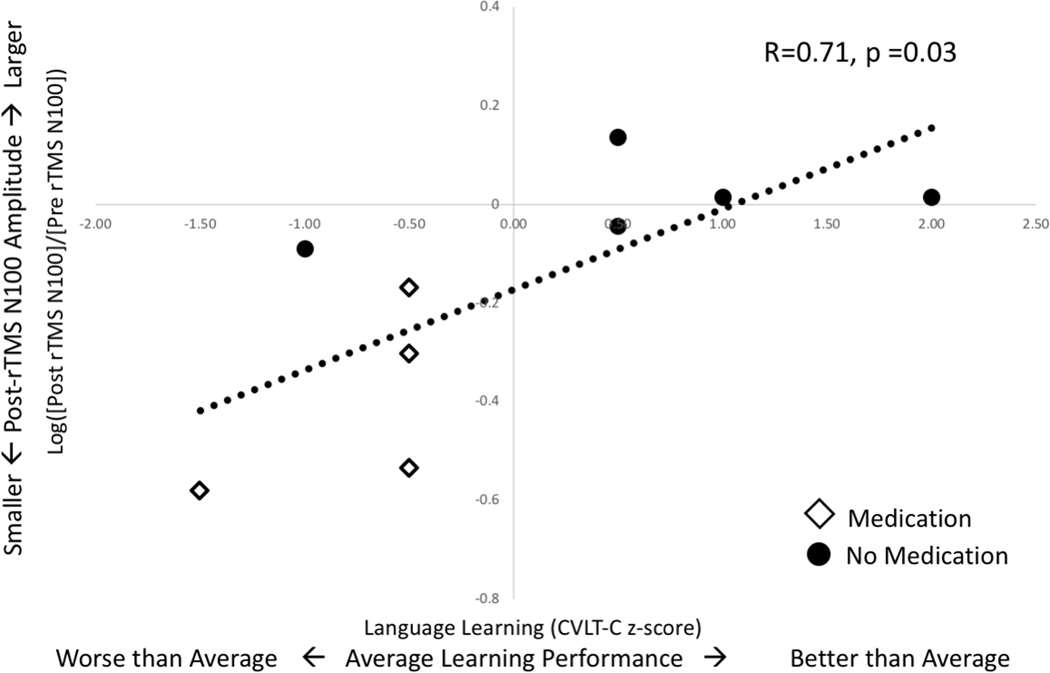
Figure 5. TEP Plasticity Correlates with Language Learning:
TEP plasticity, a change from baseline amplitude, is represented here as movement away from the x-axis. A decrease in N100 TEP amplitude after rTMS (values below x-axis) correlates with worse language learning scores while an increase in N100 TEP amplitude correlates with better scores. The trend line is fitted to all 9 points. However, it is notable that medicated (diamonds) and unmedicated (circles) children cluster differently with regard to these measurements.

