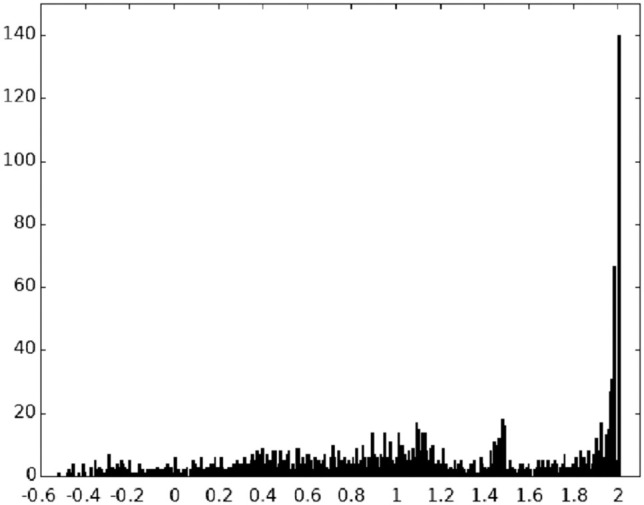
FIGURE 2.

Distribution of C-values in 16S rRNAs. The number of sequences scoring each given C (conservation) value is shown for the 1961 sequences in our 16S rRNA database representing organisms across the entire phylogenetic spectrum. Note that the C-value 2.000 corresponds to bases that are universally conserved.
