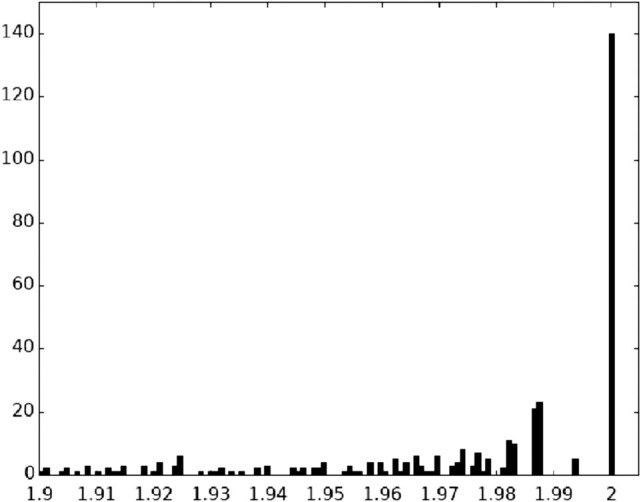
FIGURE 3.

Distribution of C-values between 1.9 and 2.0. An expanded view of the distribution of the highest C-values shown in Figure 1. The most prominent peak, which has the maximum possible phylogenetic conservation value of C = 2.000, indicates that there are 140 positions that are invariant across the phylogenetic spectrum represented in the1961aligned sequences in our database.
