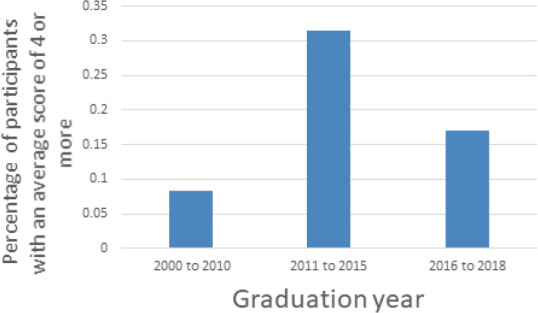
Figure 3.

Participants’ average responses to the whole questionnaire grouped by their graduation year
R Foundation for Statistical Computing, Vienna, Austria version 3.6.0 was used for the analysis.

Participants’ average responses to the whole questionnaire grouped by their graduation year
R Foundation for Statistical Computing, Vienna, Austria version 3.6.0 was used for the analysis.