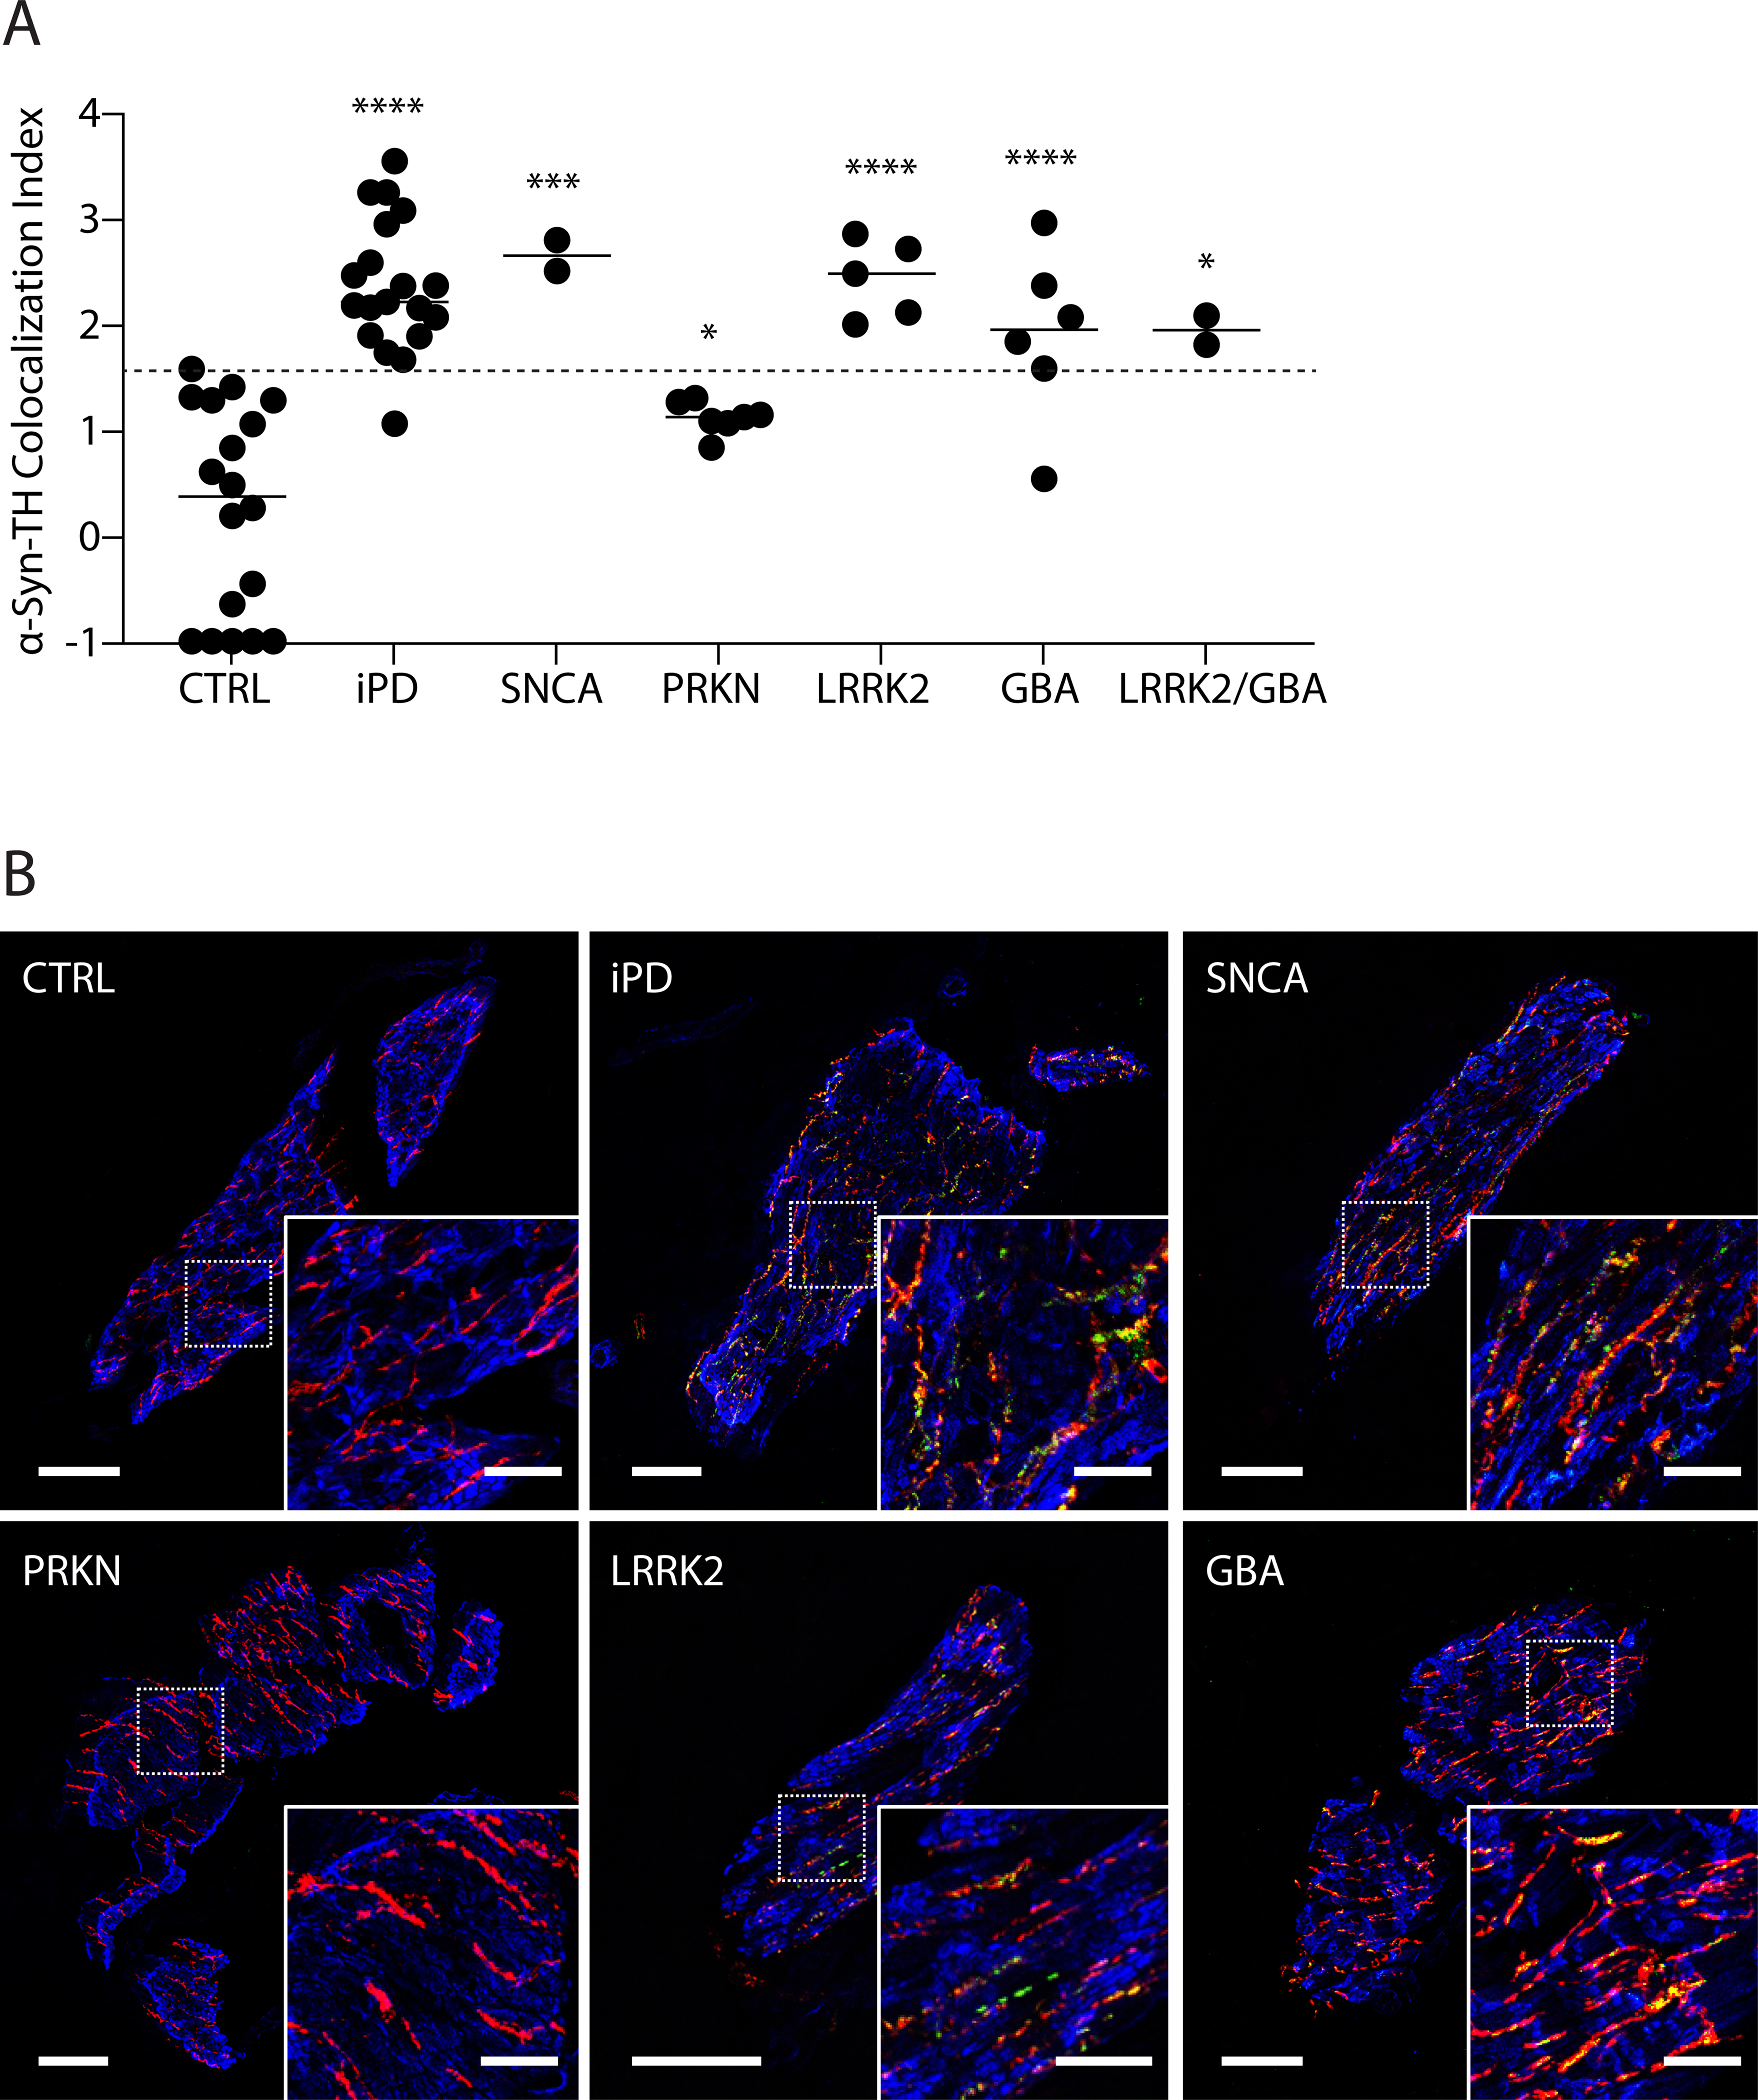
Figure 1: Individual values for α-synuclein (α-syn)-tyrosine hydroxylase (TH) colocalization indices and representative confocal microscopic images.

(A) individual data for control subjects (CTRL) and patients with idiopathic Parkinson disease (iPD) or mutations in SNCA, PRKN, LRRK2, GBA, or digenic LRRK2/GBA. Dashed line shows the upper limit of CTRLs. Horizontal lines indicate median values in each group. Abbreviations: ns=not significant. (*) p < 0.05, (**) p < 0.01, (***) p < 0.001, and (****) p < 0.0001 vs. CTRL. (B) Representative confocal microscopic images of immunoreactive α-syn (green), tyrosine hydroxylase (TH, red), smooth muscle actin (blue), and α-syn colocalized with TH (yellow) in arrector pili muscles from skin biopsies. Scale bars = 50 μm for main image, 20 μm inserts. Note that the iPD, SNCA, LRRK2, and GBA groups have elevated colocalization indices compared to CTRL.
