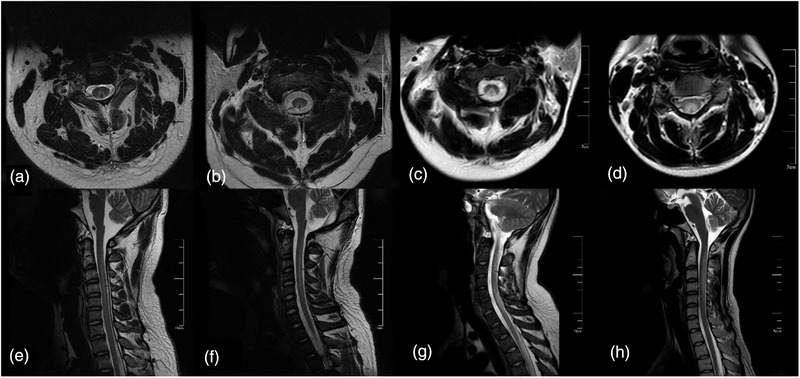
FIGURE 1.

Spinal magnetic resonance imaging. (a–d) Transverse sections of spinal cord showing “V,” inverted “V,” triangle, and elliptical signals. (e–h) Sagittal sections showing high T2 signal lesion involving the dorsal longitudinal segment of the spinal cord
