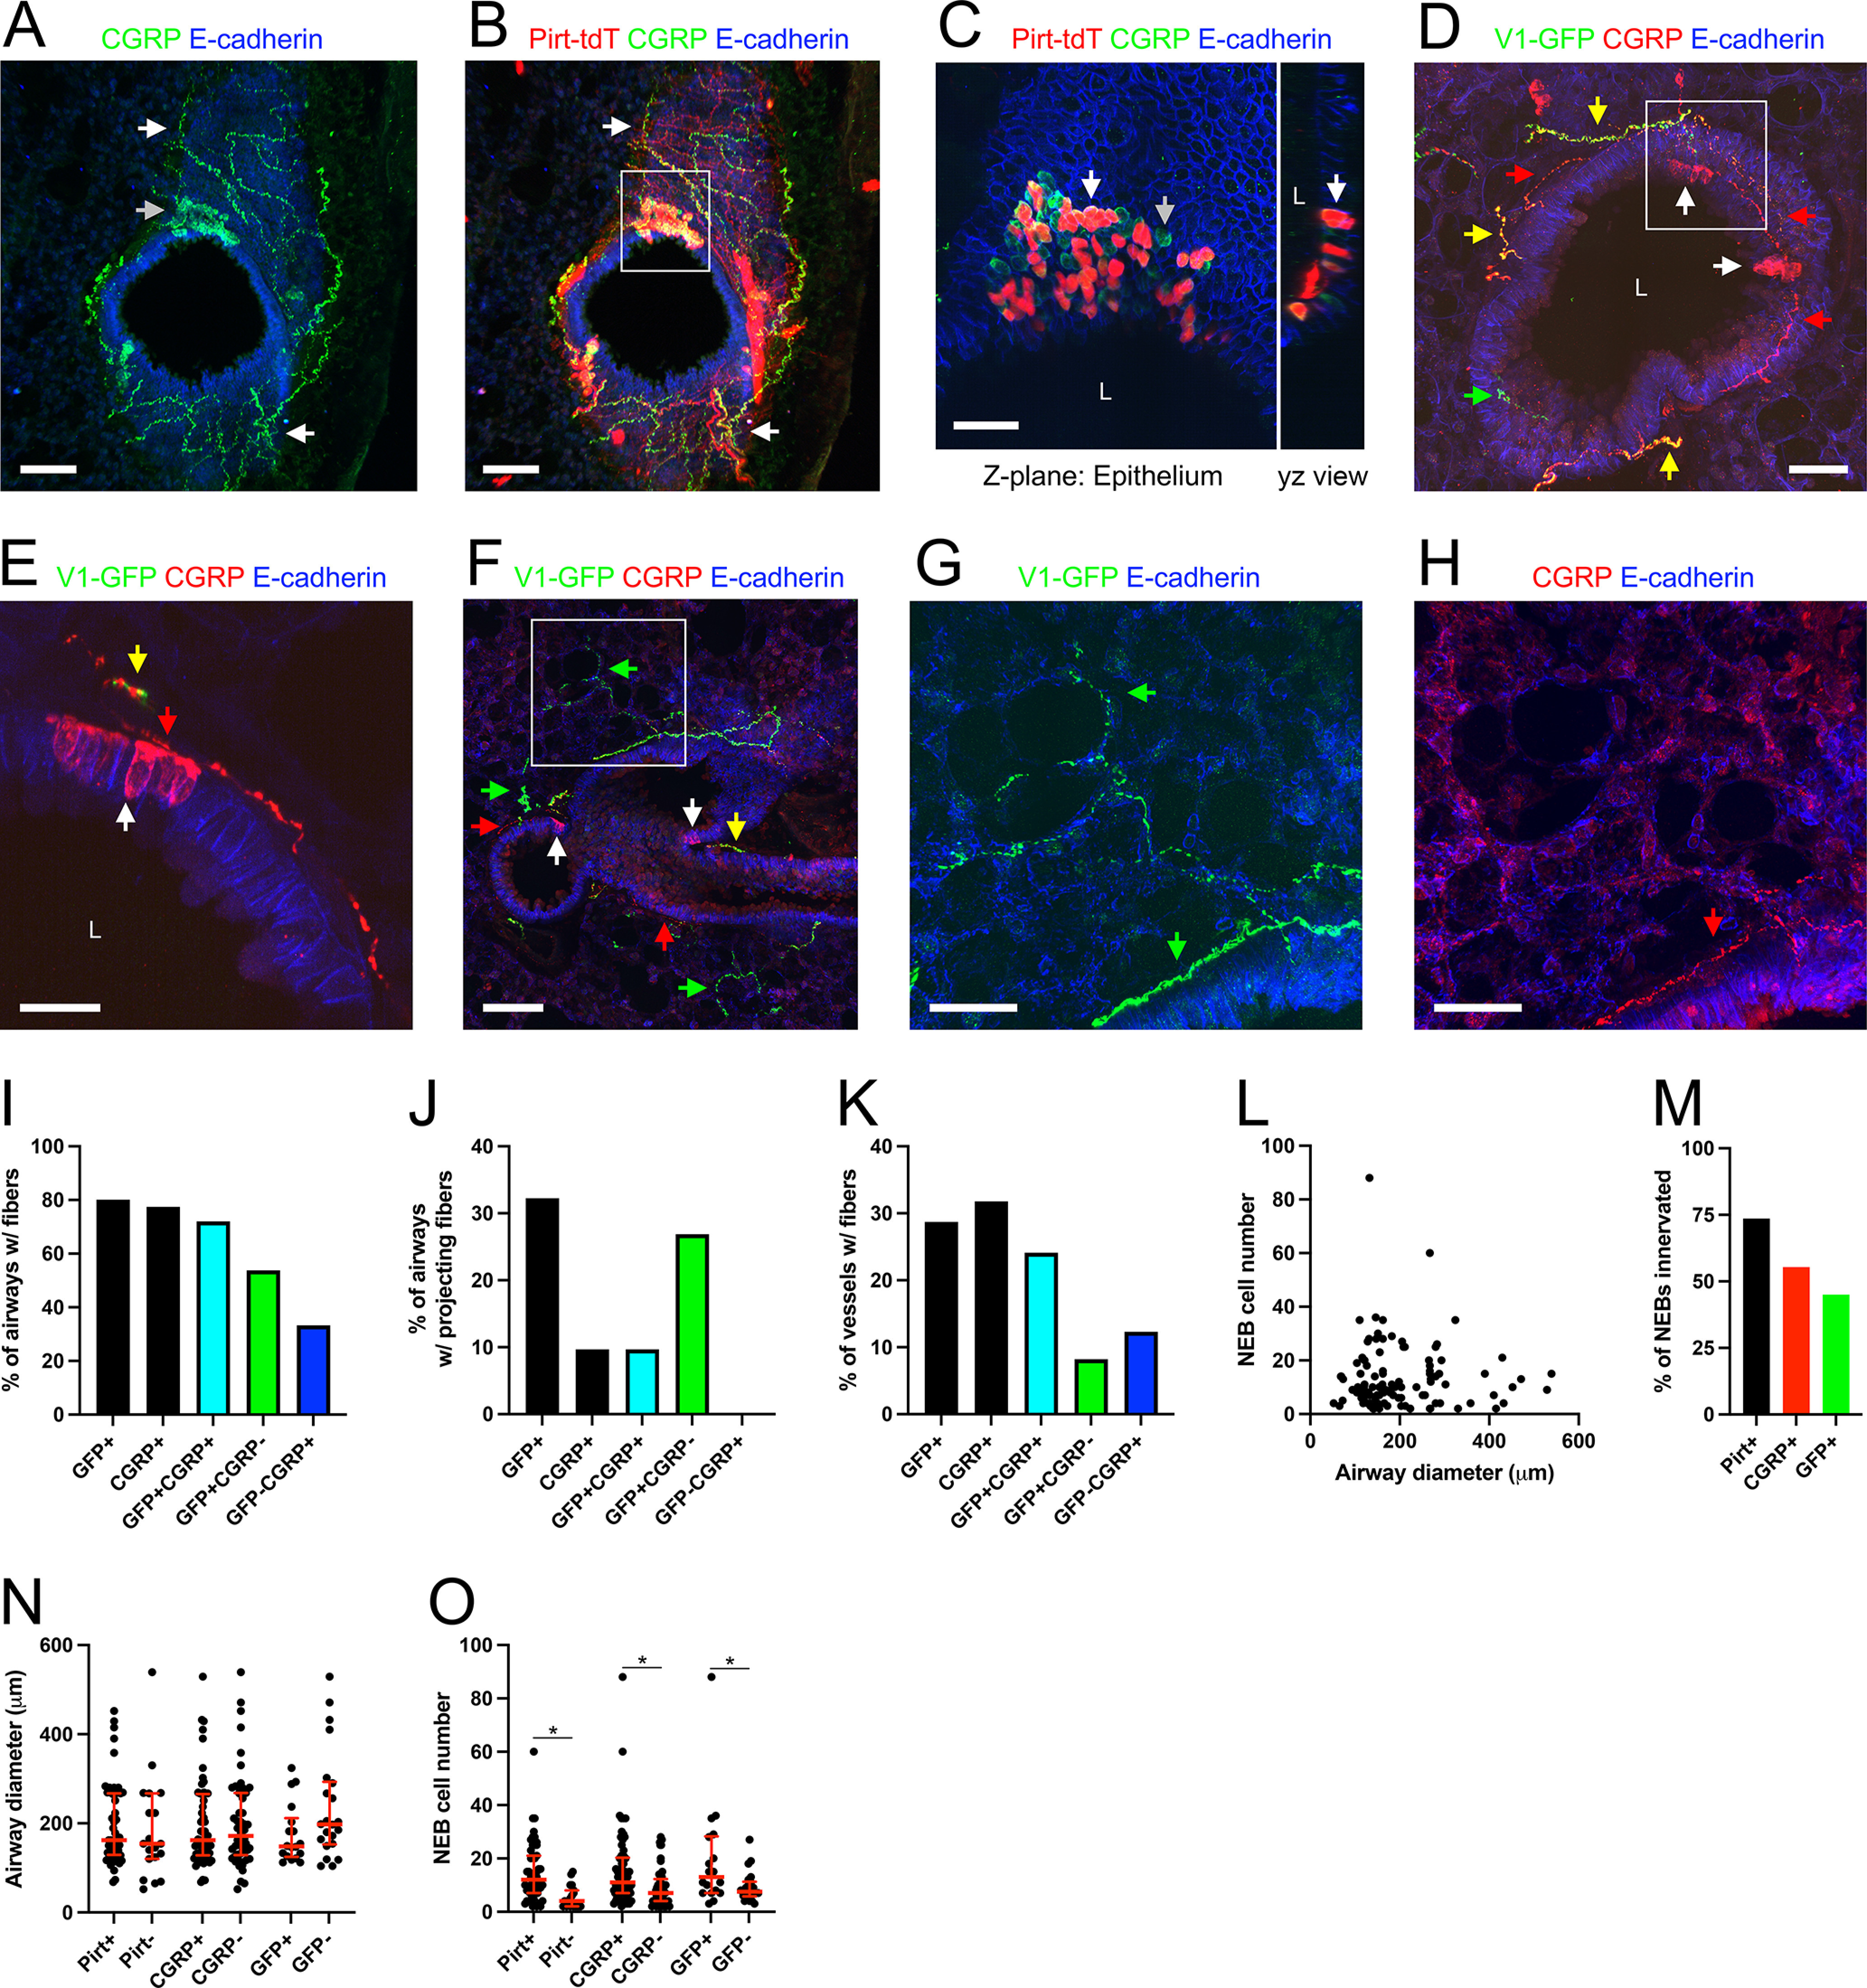
Figure 11.

Mapping the lung innervation by CGRP. A–C, Pirt-Ai9 lung slice stained for CGRP (green), E-Cadherin (blue), and tdTomato+ pirt-expressing fibers/cells (red, in B, C). A, B, CGRP+ fibers (white arrows) innervating a conducting airway. Note the cluster of CGRP+ epithelial cells (gray arrow) comprising an NEB. C, Higher magnification of white box in B, showing the NEB with both CGRP+/Pirt+ cells (white arrow) and CGRP+/Pirt-negative cells (gray arrow). Note the gain of the red and green channels have been decreased to better visualize the NEB cells. Thus, less bright CGRP+ and Pirt+ fibers are no longer visible. D–H, lung slice of TRPV1Cre mouse following vagal injection with AAV9-flex-GFP, stained for CGRP (red), E-Cadherin (blue), and GFP+ TRPV1-expressing vagal fibers (green). D, F, GFP+/CGRP+ (yellow arrows), GFP+/CGRP-negative (green arrows) and GFP-negative/CGRP+ (red arrows) fibers innervate the conducting airways. Also shown are CGRP+ NEBs (white arrows). E, Higher magnification of white box in D, showing an NEB with associated innervation by both GFP+/CGRP+ (yellow arrows) and GFP-negative/CGRP+ (red arrows) fibers. G, H, Higher magnification of white box in F showing GFP+ fibers innervating a conducting airway and projecting into the alveolar region (green arrow, in G) and CGRP+ fibers innervating a conducting airway but not projecting into the alveolar region (red arrow, in H). I–K, Quantification the % of conducting airways with fibers (I), the % of conducting airways with fibers that project out to the alveolar region (J), and the % of blood vessels with fibers (K) for CGRP+ fibers and TRPV1+ (GFP+) fibers. Data in I–K are derived from three TRPV1Cre mice with AAV9-flex-GFP vagal injections (186 conducting airways, 195 blood vessels). L, Correlation of the number of CGRP+ cells within an NEB and the diameter of the conducting airway. M, Percentage of NEBs innervated by Pirt+, CGRP+, and TRPV1+ (GFP+) fibers. N, Median (with interquartile range) airway diameter of conducting airways at locations of individual NEBs, grouped by innervation (or lack of) by Pirt+, CGRP+, and TRPV1+ (GFP+) fibers. O, Median (with interquartile range) number of CGRP+ cells within the NEBs, grouped by innervation (or lack of) by Pirt+, CGRP+, and TRPV1+ (GFP+) fibers. Data in L–O are derived from three TRPV1Cre mice with AAV9-flex-GFP vagal injections and three Pirt-Ai9 mice (in total, 112 NEBs). * denotes significant difference between NEBs with and without innervation (Mann–Whitney two-tailed U test, p < 0.05, see text for precise values). In some images, lumens are denoted by “L.” Scale bars denote 100 μm (A, B, F), 50 μm (D, G, H), 30 μm (C), or 20 μm (E).
