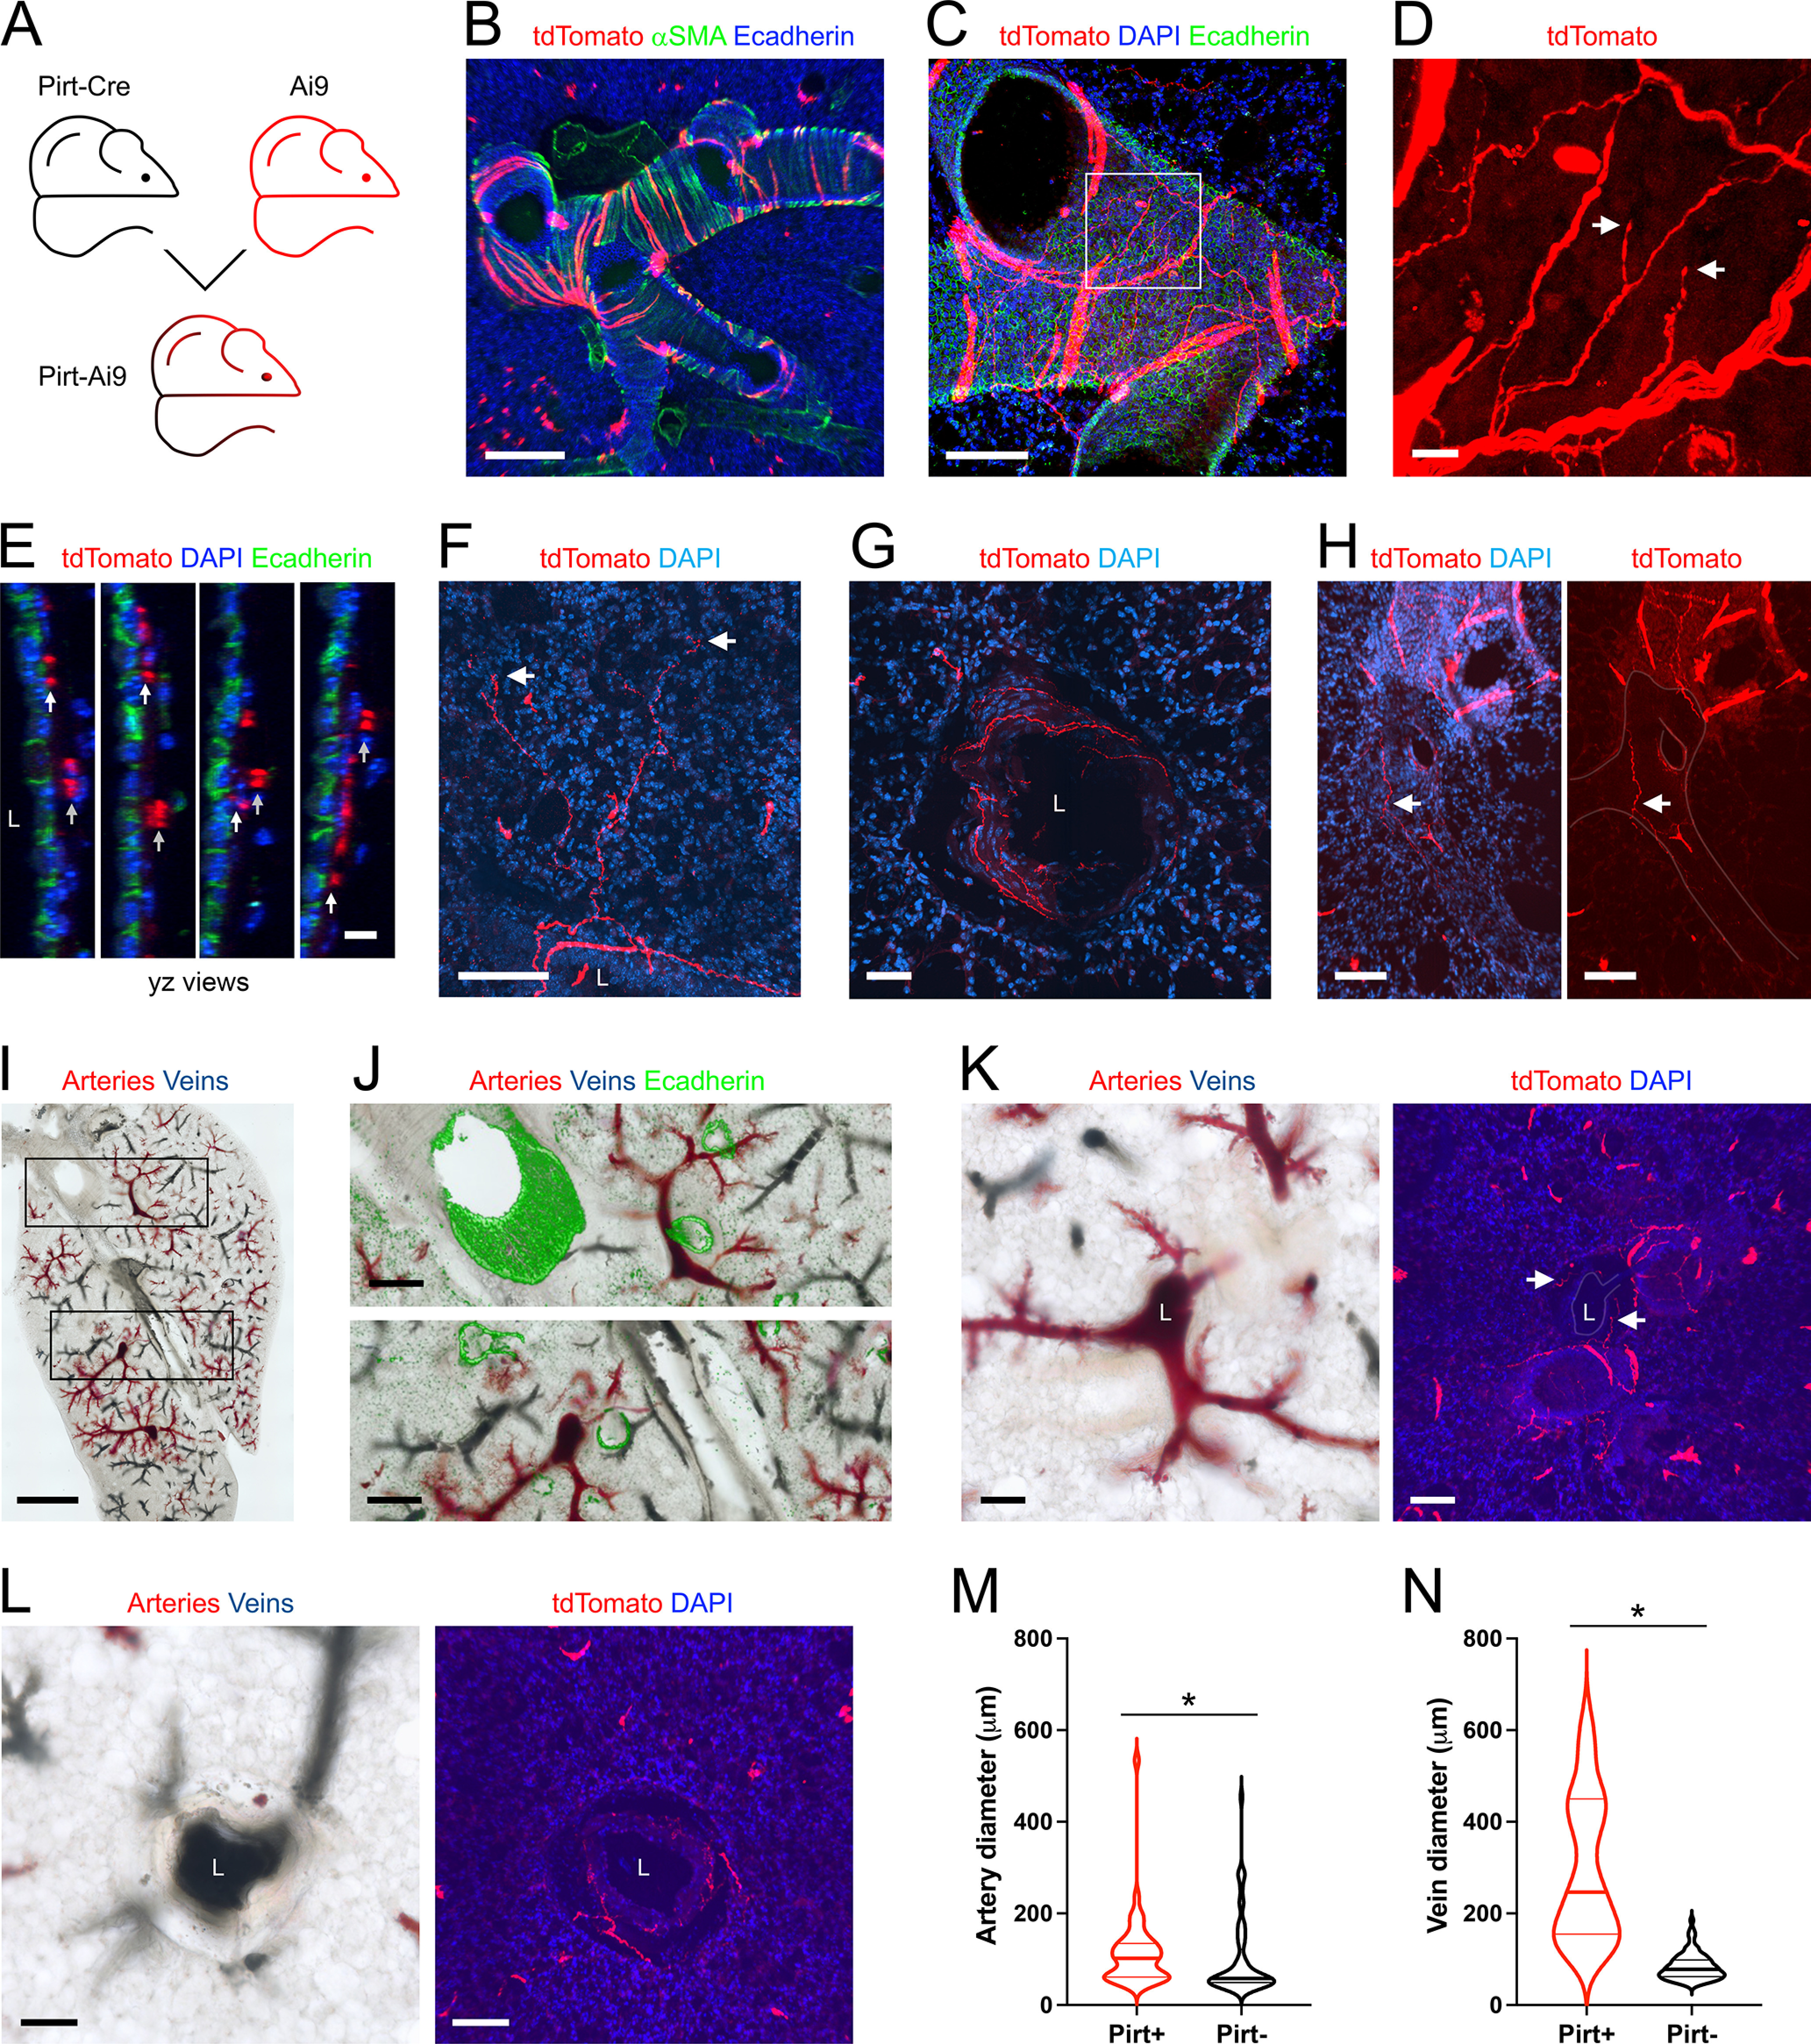
Figure 2.

Mapping the lung innervation by Pirt+ nerves. A, Approach for labeling all Pirt+ afferents with tdTomato. B, Lung slice stained for α smooth muscle actin (αSMA, green) and E-Cadherin (blue) showing tdTomato expression (red) in some airway smooth muscle cells. C, Lung slice stained for E-Cadherin (green) and DAPI (blue) showing tdTomato-expressing nerves (red) innervating a large conducting airway. D, Higher magnification of white box in C (red channel only), with identified tdTomato+ nerve terminals (white arrows). E, yz projections of C, showing separate layers of tdTomato+ innervation: individual fibers in close proximity to the epithelial layer (white arrows); thicker cables (comprised of multiple fibers) within the outer smooth muscle layer (gray arrows). F, Lung slice stained for DAPI (blue) showing a tdTomato+ fiber (red) projecting from a conducting airway into the alveolar region, with identified nerve terminals (white arrows). G, Lung slice stained for DAPI (blue) showing a tdTomato+ fiber (red) innervating a blood vessel. H, Lung slice stained for DAPI (blue, left panel only) showing a tdTomato+ (red) fiber (white arrow) innervating a blood vessel (outline superimposed by gray line). I, Brightfield image of lung slice from Pirt-Ai9 with latex labeling of pulmonary arteries (pink latex) and pulmonary veins (blue latex). J, Higher magnification of black boxes in I, with overlay of E-Cadherin staining (green). K, Brightfield image (left) and fluorescent image (right) stained for DAPI (blue), with tdTomato+ (red) fibers (white arrows). L, Brightfield image (left) and fluorescent image (right) stained for DAPI (blue) with tdTomato+ (red) fibers. M, N, Violin plots for the diameters of arteries (M) and veins (N) with (red) or without (black) tdTomato+ fiber innervation. Data are derived from 3 Pirt-Ai9 mice (101 pulmonary arteries, 104 pulmonary veins). * denotes significant difference between groups (Mann–Whitney two-tailed U test, p < 0.05, see text for precise values). In some images, lumens are denoted by “L.” Scale bars denote 1 mm (I), 300 μm (J), 200 μm (B), 100 μm (C, F, H, K, L), 50 μm (G), 15 μm (D), or 10 μm (E).
