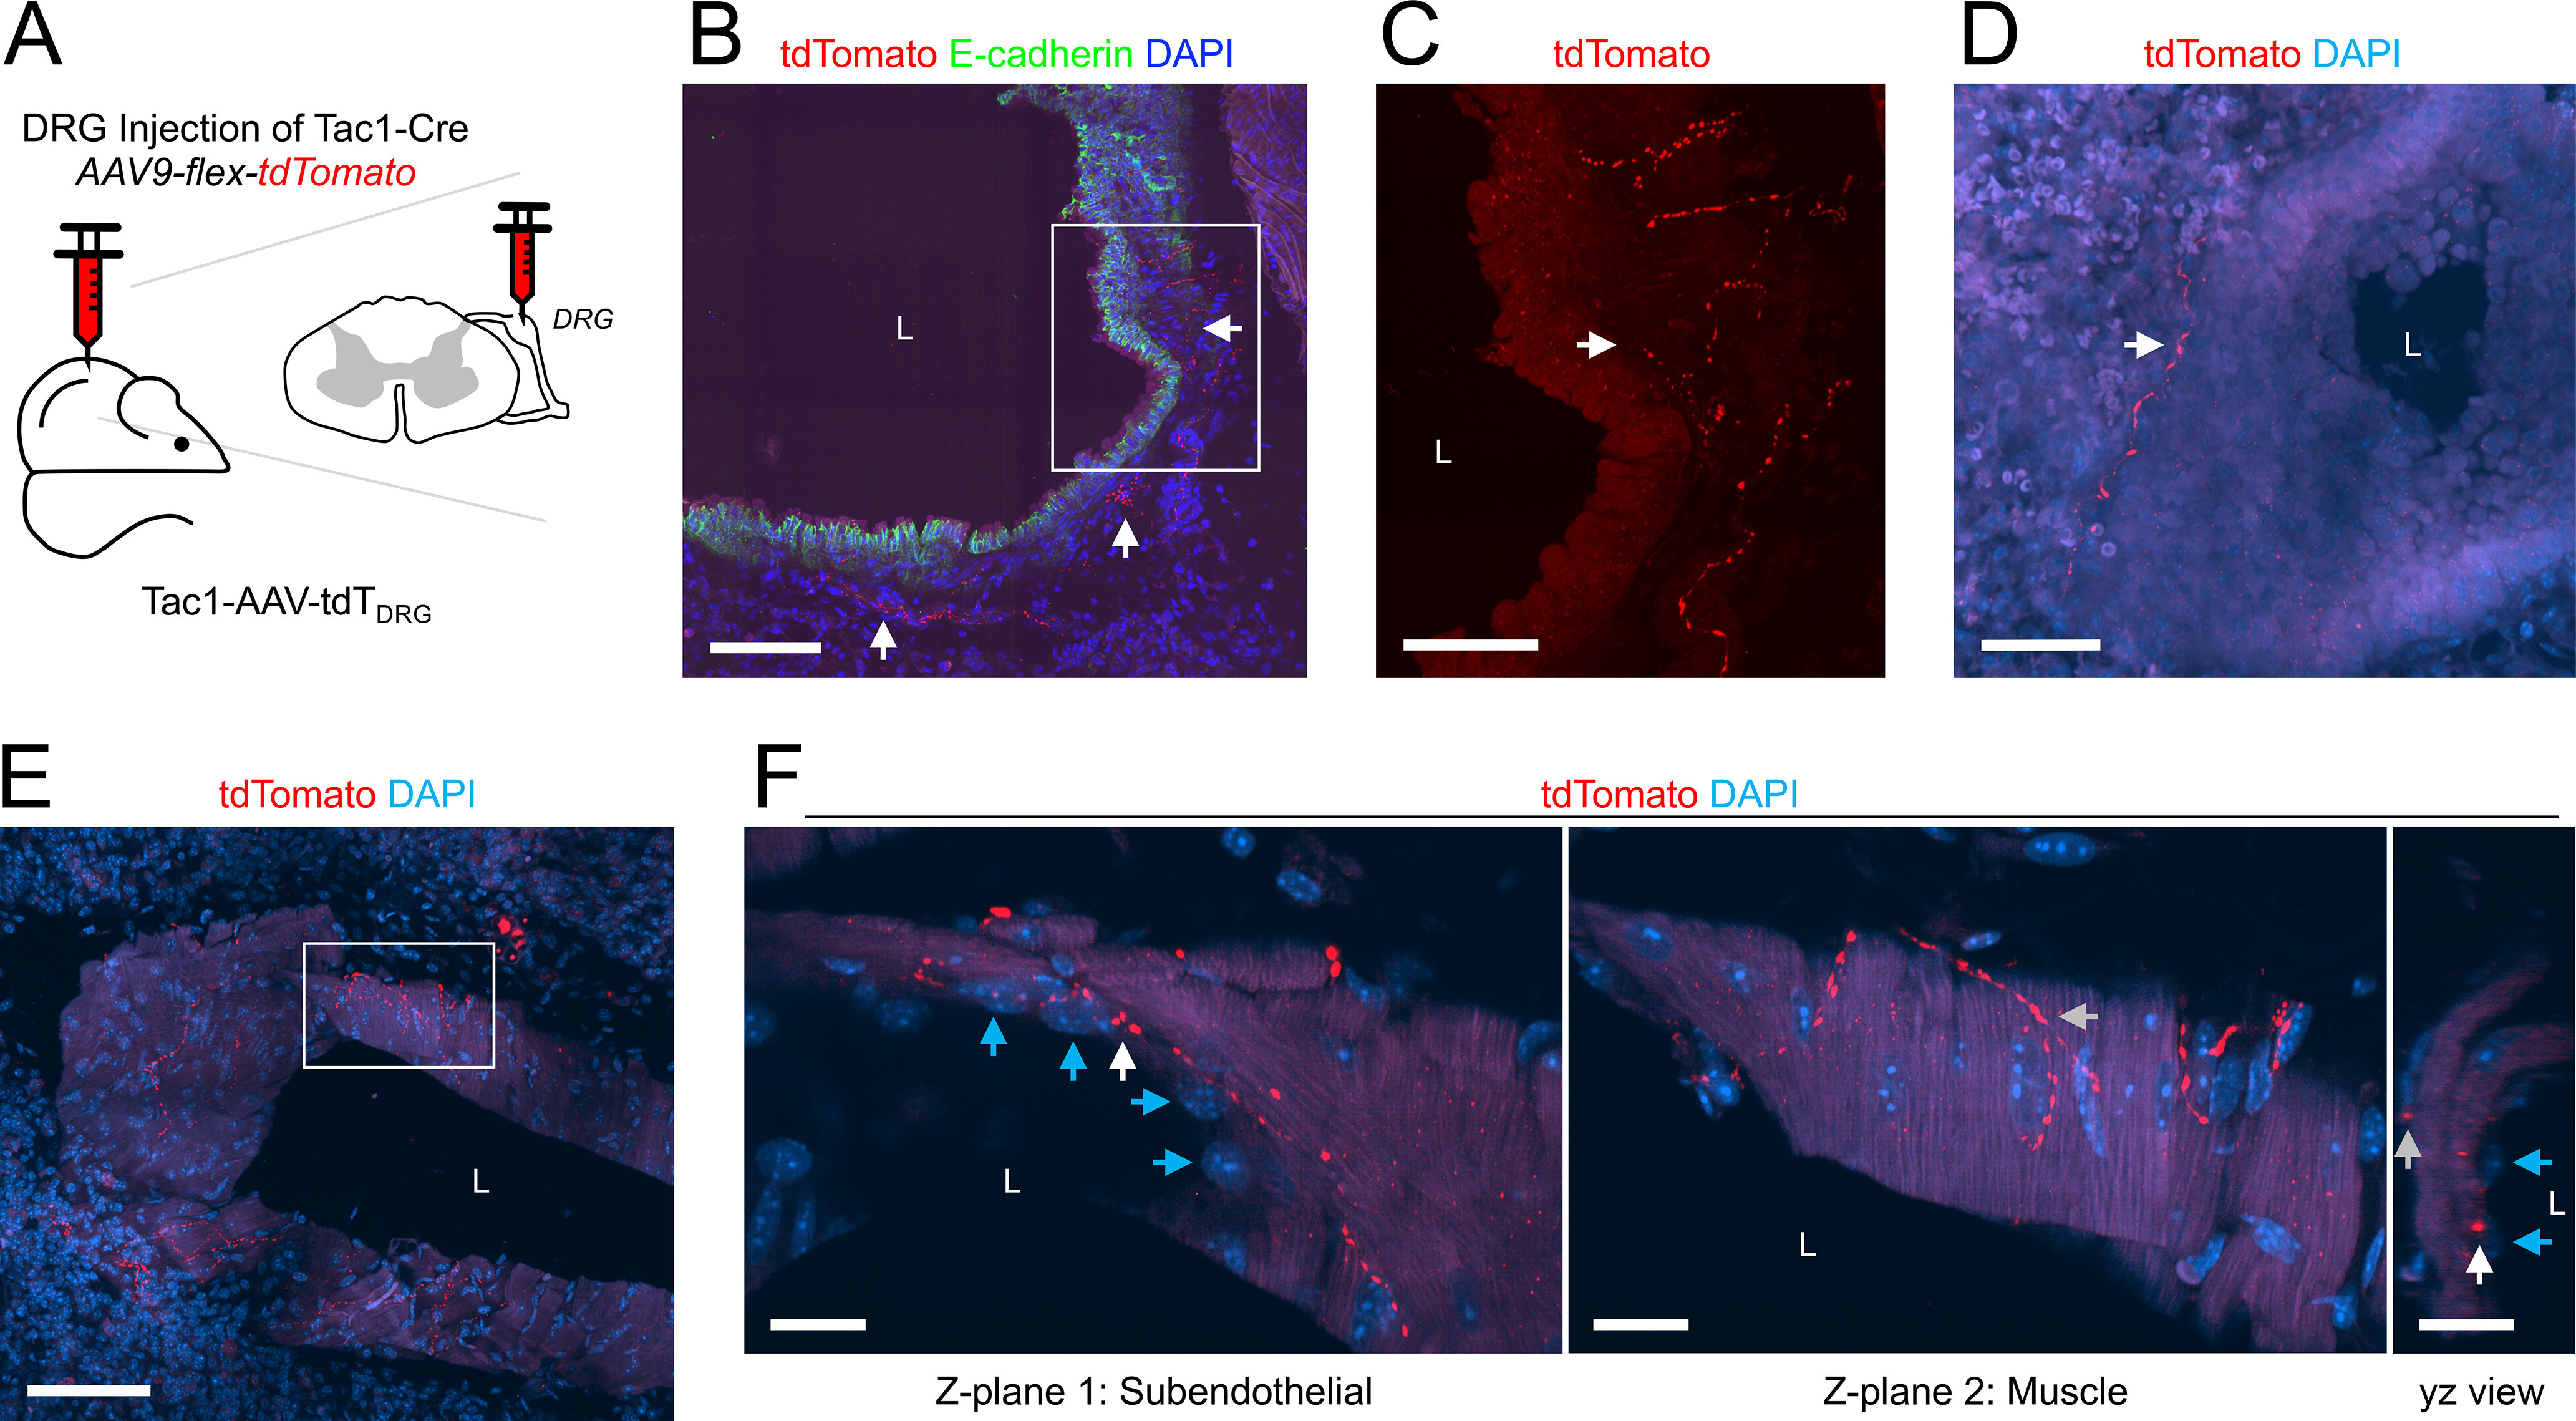
Figure 8.

Mapping the lung innervation by Tac1+ fibers projected from DRG. A, Approach for labeling Tac1+ neurons in the DRG with tdTomato. B, Lung slice stained for E-cadherin (green) and DAPI (blue) showing tdTomato+ (red) fibers innervating a large conducting airway (white arrows). C, Higher magnification of white box in B (red channel only) showing tdTomato+ fibers (white arrow). D, E, Lung slice stained for DAPI (blue) showing tdTomato+ (red) fibers innervating a small conducting airway (white arrow, D) and a large blood vessel (E). F, Individual z-planes (1, 2, left) and the corresponding yz view (right) of the white box in E, at higher magnification, with identified endothelial cells (blue arrows) adjacent to the vessel lumen, showing fibers expressing tdTomato innervating both the subendothelial layer (white arrows) and the muscle layers (gray arrows). In some images, lumens are denoted by “L.” Scale bars denote 100 μm (B, E), 50 μm (C, D), or 20 μm (F).
