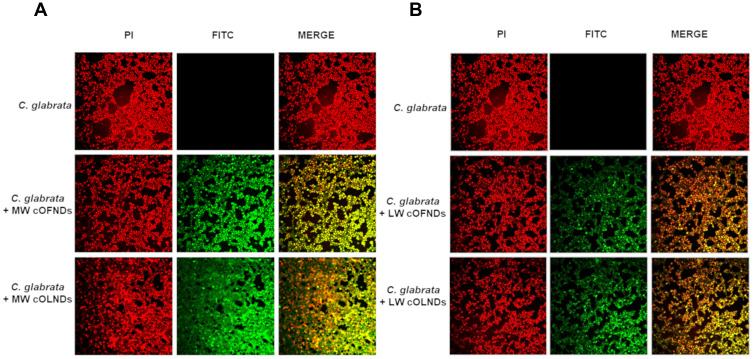
Figure 8.
Confocal microscopy images of both MW and LW cND internalization by C. glabrata. C. glabrata (108 CFUs/mL) were left alone or incubated with 10% v/v FITC-labeled MW (A) or LW (B) cOFNDs or cOLNDs for 3 h. After staining yeasts with PI, confocal fluorescent images were taken using FITC and TRITC filters. Data are shown as representative images from three independent experiments. Red: PI. Green: FITC. Magnification: 100X.

