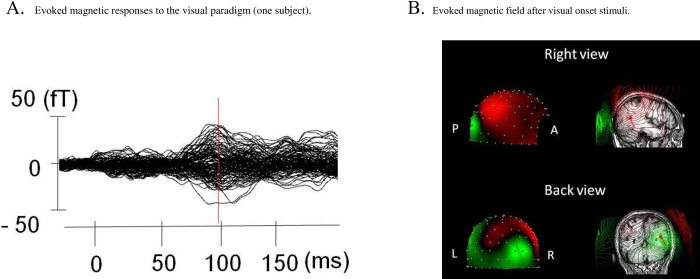
Fig 2.
A, Representative example of the magnetic responses to the visual stimuli obtained from one participant. MEG waveforms (160 channels) are overlaid at the corrected baseline. Isocontour maps of the magnetic field (strength denoted by color, varying from green (flux-in) to red (flux-out)) at the response peak and sensor locations (white dots) are shown. B, Isocontour maps of the magnetic field after apparent motion visual stimuli. A, anterior direction; P, posterior direction; L, left; R, right.

