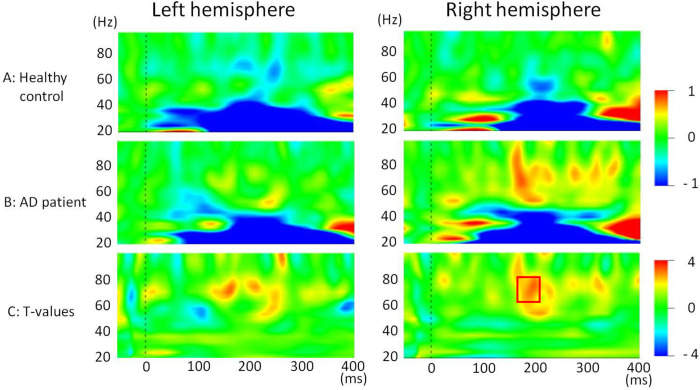
Fig 4.
Grand average stimulus-related time–frequency maps using a Morlet wavelet transform for (A) healthy controls (n = 17) and (B) AD patients (n = 17) for both hemispheres. This analysis will reveal a mixture of evoked and induced power changes because phase stability in the responses is not necessary. (C) Stimulus-related time–frequency T-value maps for healthy control and Alzheimer’s disease participants.

