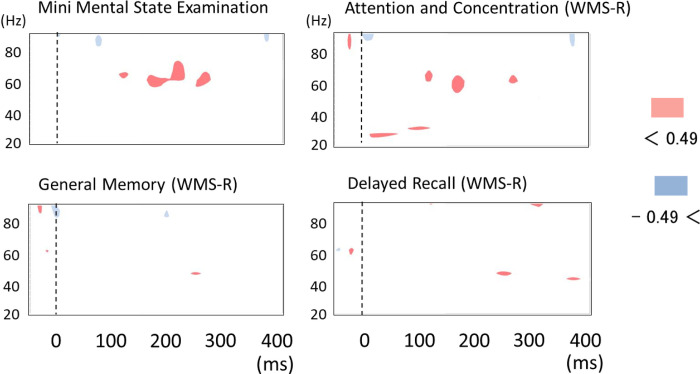
Fig 6. Time–frequency maps of correlation coefficient between visual stimulation induced power change in right hemisphere and Mini Mental State Examination (MMSE) score or Wechsler Memory Scale-Revised (WMS-R) indexes in AD patients (n = 17).
Red areas show positive correlation (correlation coefficient > 0.5). Blue areas show negative correlation (correlation coefficient < - 0.5). Prominent positive correlation is found for the MMSE score and WMS-R index for attention and concentration at around 200 ms after stimuli.

