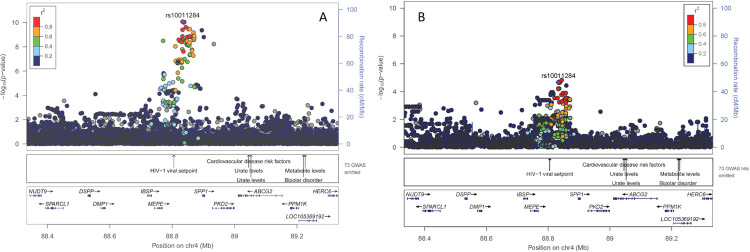
Fig 1. Regional association plot for the region around rs10011284 on chromosome 4: (A) GCKD study (discovery) and (B) YFS cohort (replication).
Plots are produced in LocusZoom and show the most strongly associated SNP (purple diamond), SNP colors reflect LD correlation (r2) using 1000G EUR population as reference. The -log10 p-values (left y-axis) of SNPs are shown according to their chromosomal positions (x-axis, GRCh37); the genetic recombination rates are shown on the right y-axis. The -log10 p-values are shown for both genotyped and imputed SNPs distributed in a 0.8-megabase genomic region.

