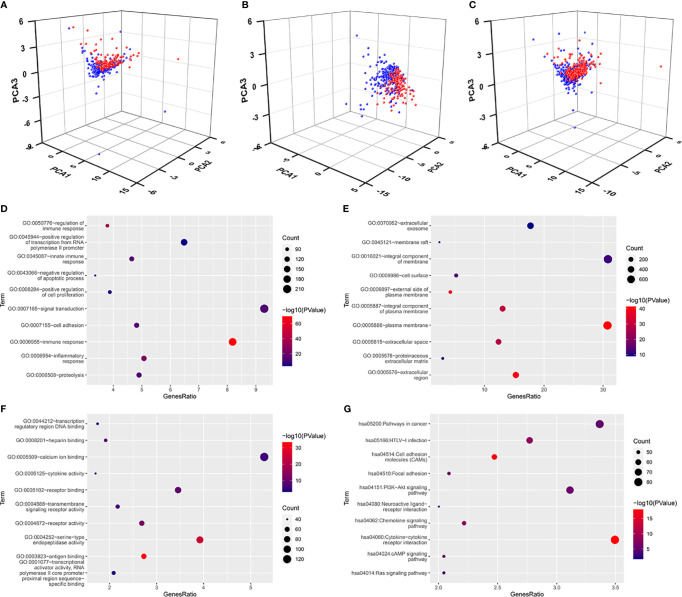
Figure 5.
Principal component analyses and enrichment analyses. (A–C) Principal component analyses (PCA) plots depicted distinct distribution of high- and low-risk groups based on these seven FI-DEGs in the training group (A), validation group (B), and entire group (C). Blue means low-risk group. Red means high-risk group. (D–F) Top 10 significantly enriched GO. (D) For BP. (E) For CC. (F) For MF. (G) Top 10 significantly enriched KEGG.

