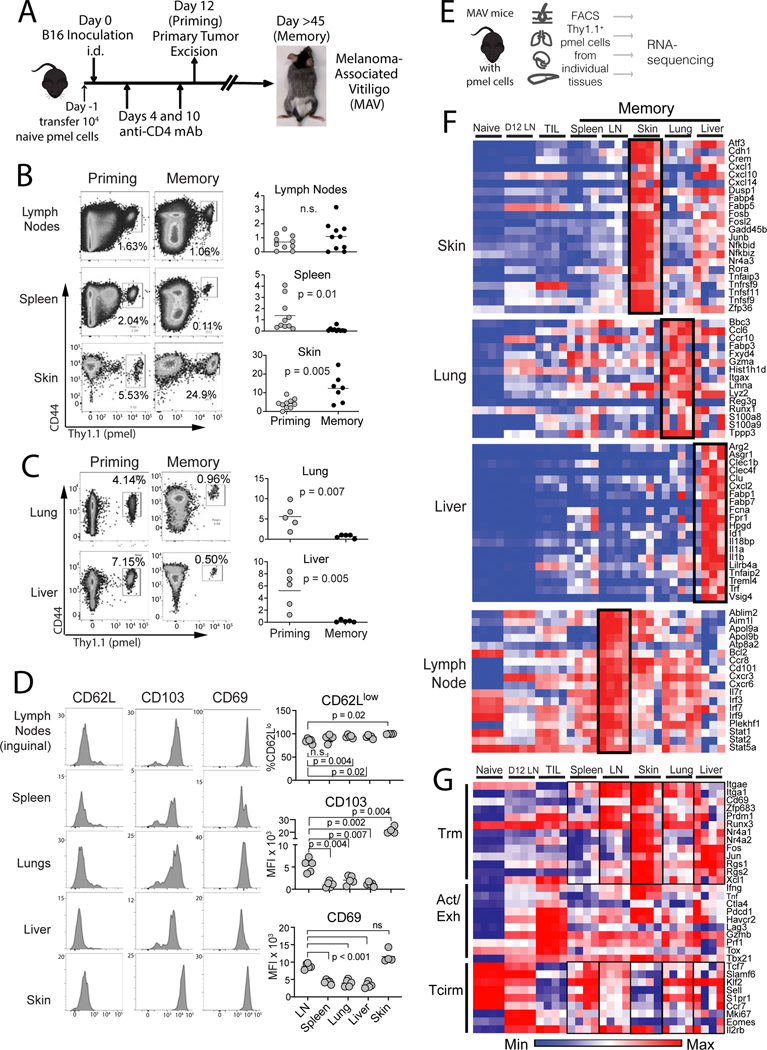
Figure 1. Mice with melanoma-associate vitiligo (MAV) sustain transcriptionally distinct melanoma-specific CD8+ T cell populations throughout lymphoid and peripheral tissues.
(A) Schematic diagram depicting the generation of MAV with sentinel pmel T cell populations. (B-C) proportion of CD44hi pmel cells (gated on total CD8+) in each tissue on the day of tumor excision (priming) or 28–45 days later (memory). (D) Phenotype of pmel cells 150 days post surgery (gated on CD8+Thy1.1+). Symbols represent individual mice; horizontal lines depict means; significance was determined by unpaired (B-C) or paired t test (D), with n.s. (non-significant) denoting p > 0.05. Flow plots depict representative mice. Data were either pooled from 2 independent experiments (B) or taken from a single representative experiment (C-D). Each experiment was conducted twice with similar results. (E) Schematic diagram depicting workflow for bulk RNAseq. (F-G) RNAseq on memory pmel T cells, relative to pmel cells from naïve spleens (Naïve), d12 tumor-draining LNs (D12 LN), or from B16 tumors (TIL); heatmaps show log-transformed transcript per million (TPM) expression of (F) most differentially expressed genes in each tissue, or (G) representative Trm, Activation/Exhaustion, and Tcirm genes. (F-G) Each RNA-seq sample contained sorted pmel cells pooled from a single tissue of 5 mice, and a total of n=4 such pooled samples were analyzed for each group.

