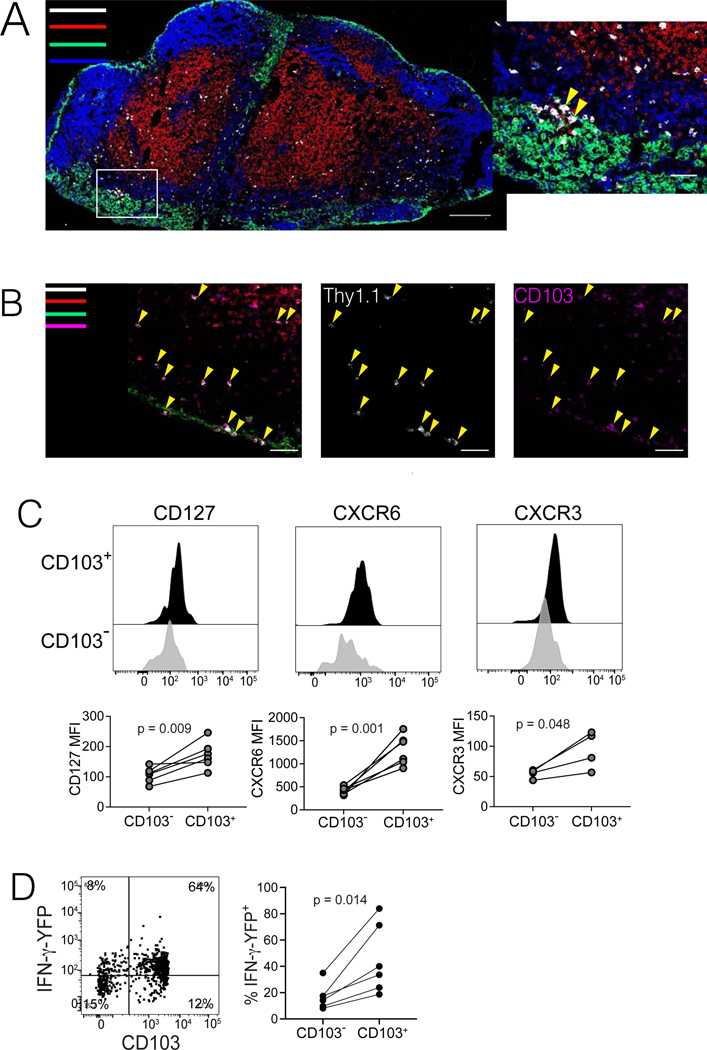
Figure 4. LN Trm cells distribute throughout T cell zones and paracortical regions of LNs, and express IFN-γ.
(A-B) Immunofluorescence confocal microscopy of pmel cells in RLN of mice with MAV. (A) Colors indicate staining for anti-CD8 (red), anti-B220 (blue), anti-CD169 (green), and anti-Thy1.1+ (pmel cells; white). Inset at right depicts pmel cells (yellow arrows) in proximity to CD169+ cells in the subcapsular sinus. (B) Staining was performed as in panel A, but including anti-CD103 (magenta) instead of B220, to identify CD103-expressing Trm cells. Yellow arrows indicate Thy1.1+ pmel cells (middle), most of which co-express CD103 (right), both in the T cell zone and subcapsular sinus regions. Microscopic images are each representative of at least two sections taken from multiple RLNs, with scale bars indicated. (C) Phenotypic analysis of pmel cells (gated on CD8+Thy1.1+ cells) taken from inguinal LNs of mice with MAV, depicting differences in phenotypes of CD103+ versus CD103− populations. (D) Mice were treated to induce MAV as in Figure 1A, however pmel tracer populations expressed an IFNγ-IRES-YFP reporter. Flow cytometry was conducted on cells taken from RLNs to detect expression of YFP in CD103+ Trm population (direct ex vivo, without peptide restimulation). (C-D) Histograms/dot plots depict representative samples; data shown in each panel are either pooled from two independent experiments (CD127 and CXCR6 and YFP) or from a single experiment (CXCR3). Experiments were conducted twice with similar results. Points represent values from individual mice with lines joining populations within a mouse. Significance was determined by paired t test; n.s. (not significant) denotes p > 0.05.

