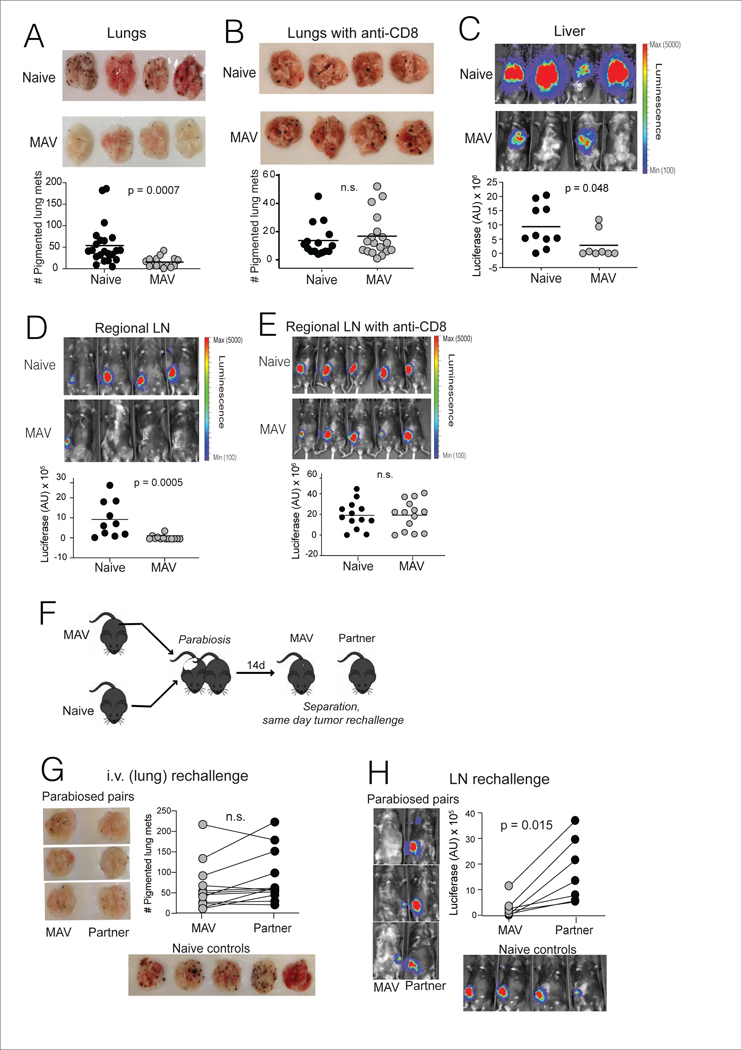
Figure 6. Trm cells provide protection against melanoma in regional lymph nodes.
(A-G) MAV was induced as in Figure 1A, but without transfer of tracer pmel cell populations. Mice were rechallenged 45d post tumor-excision through various routes: (A-B) 1×10⁵ B16 cells were injected into the tail vein, and surface lung metastases were counted 21d later; (B) mice recieved anti-CD8 depleting mAb on days −4, −2, +2, +9 and +16 relative to tumor rechallenge. (C) 0.25 × 10⁵ B16-luciferase cells were injected into the portal vein, and liver metastases were imaged 21d later, or (D-E) 0.25 × 10⁵ B16-luciferace cells were directly injected into regional lymph nodes (RLN) draining the prior site of tumor excision, and LN tumor burden was imaged 7d later. (E) mice received anti-CD8 depleting mAb on days −4, −2, and +2 relative to tumor inoculation. (F) Schematic diagram depicting parabiosis tumor rechallenge experiments. Mice were separated after 14 days and rechallenged as described above to produce tumor growth in lungs (G) or (H) lymph node, with tumor growth assessed as in panels A and D. Naïve controls were C57BL-6 mice that received concurrent tumor inoculation via the indicated route. Symbols represent individual mice, (A-E) horizontal lines depict means, and (G-H) lines join parabiotic pairs. Significance was determined by Mann Whitney test (A, B, and D), unpaired t test (C and E), or Wilcoxon matched pairs test (F and G); n.s. (non-significant) denotes P > 0.05. Data in each panel are pooled from two independent experiments.

