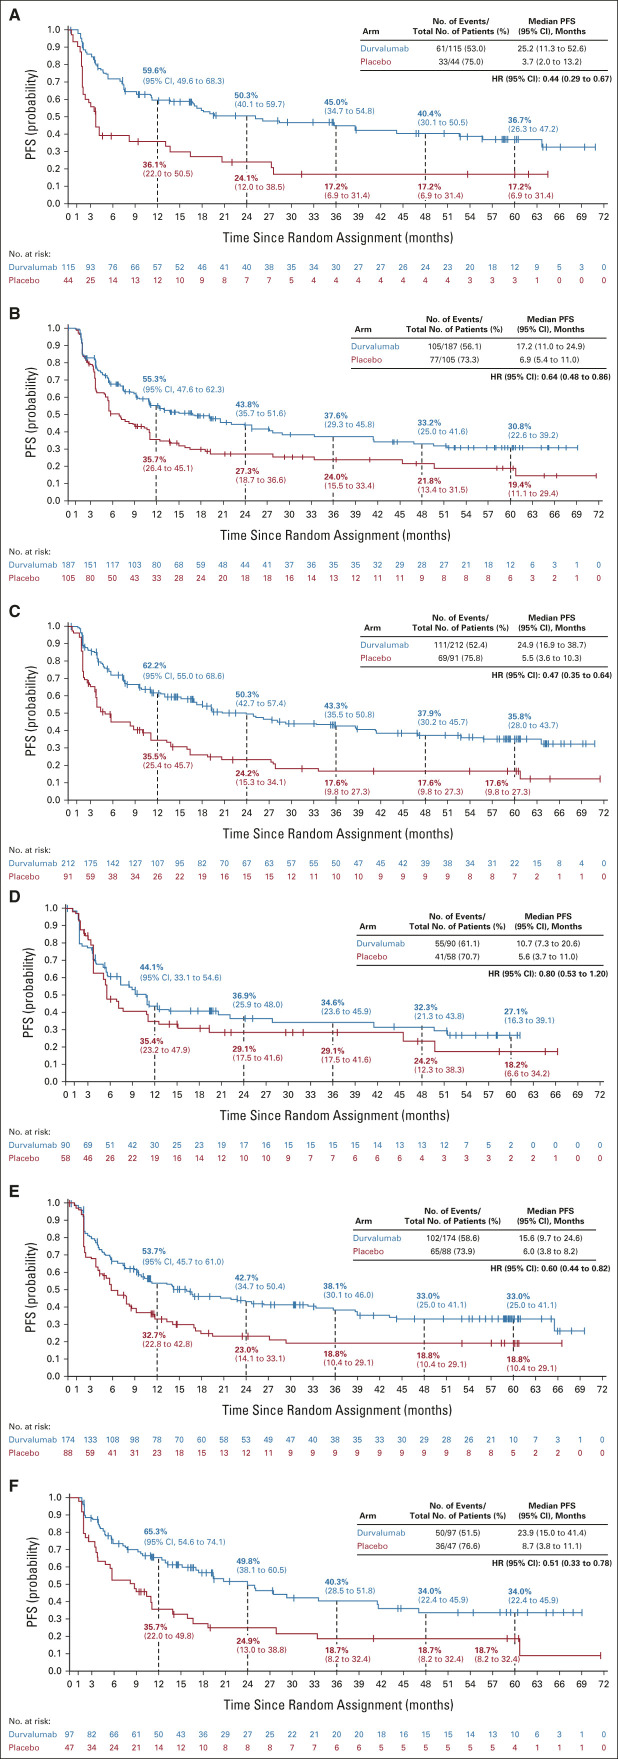
FIG A3.
Updated PFS (blinded independent central review) by tumor PD-L1 expression level: (A) PD-L1 TC ≥ 25%, (B) PD-L1 TC < 25%, (C) PD-L1 TC ≥ 1%, (D) PD-L1 TC < 1%, (E) unknown PD-L1 status, and (F) PD-L1 TC 1%-24%. The vertical dashed lines indicate yearly landmarks; the associated numerical values represent the PFS rates at the landmark. HR, hazard ratio; PD-L1, programmed cell death-ligand 1; PFS, progression-free survival; TC, tumor cell.

