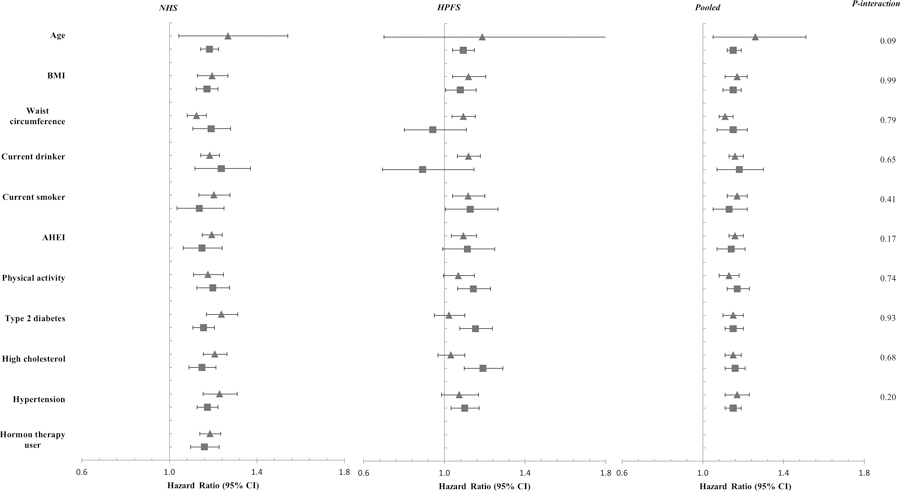
Figure 2. Stratified analysis of the association between gallstone history and total mortality.

Covariates include age (months), body mass index (BMI, kg/m2), white race (yes/no), marital status (yes/no), smoking status (never, past, current smoker), smoking amount and duration (0, 0–9, 10–24, 25–44, ≥45 pack years), alcohol drinking status (women: 0, 0.1–4.9, 5.0–9.9, 10.0–14.9, ≥15.0 g/d; men: 0, 0.1−4.9, 5.0−9.9, 10.0−14.9, 15.0−29.9, or ≥30.0 g/d), physical activity (in quintile), family history of myocardial infarction (yes/no), diabetes (yes/no), and cancer (yes/no); post-menopausal hormone replacement (premenopausal, postmenopausal and HT nonuser, postmenopausal and current HT user, postmenopausal and past HT user, missing; NHS only), modified Alternative Health Eating Index Score (AHEI, alcohol excluded; in quintiles), dietary cholesterol intake (in quintiles), daily energy intake (in quintiles); status of hypertension (yes/no), diabetes (yes/no), hypercholesterolemia (yes/no); regular aspirin use (yes/no).
 indicates a lower level of the stratifying variable, i.e., age < 55 years, BMI < 30 kg/m2, weight circumference, physical activity, and AHEI score was lower than the cohort-specific median, nondrinker, nonsmoker, free of type 2 diabetes, high cholesterol, or hypertension, and hormone therapy nonuser in women;
 indicates a higher level of the stratifying variable.
