
Figure 1.
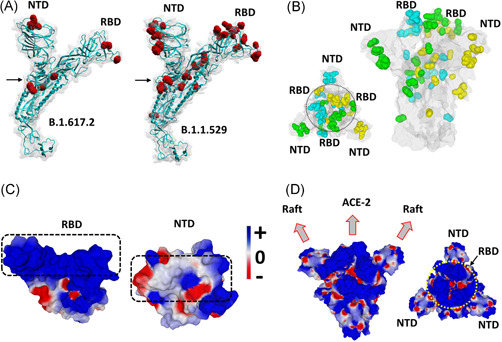
Structural analysis of omicron spike protein. (A) Molecular models of the delta B.1.617.2 and omicron B.1.1.529 spike proteins with mutations highlighted in red and the S1‐S2 cleavage site indicated by an arrow. (B) Spike trimer of the omicron variant as viewed from the host cell surface (left panel, central RBDs indicated within a circle), or perpendicularly to the virus envelope (right panel). Mutations are colored in cyan, green and yellow corresponding, respectively, to spike subunits A, B, and C. The NTD and RBD of each chain is indicated. The protein surface is colored in grey. (C) Electrostatic surface potential of omicron RBD and NTD. The color scale for the electrostatic surface potential (negative in red, positive in blue, neutral in white) is indicated. The regions of the RBD and the NTD, respectively, bound to ACE‐2 and the lipid raft are indicated by dashed rectangles. (D) Two views of the electrostatic surface potential of the trimeric spike of omicron (left panel, lateral view of the trimer perpendicular to viral envelope; right panel, top view of the trimer facing the host cell surface, the central RBDs are indicated by a yellow circle). NTD, N‐terminal domain; RBD, receptor‐binding domain