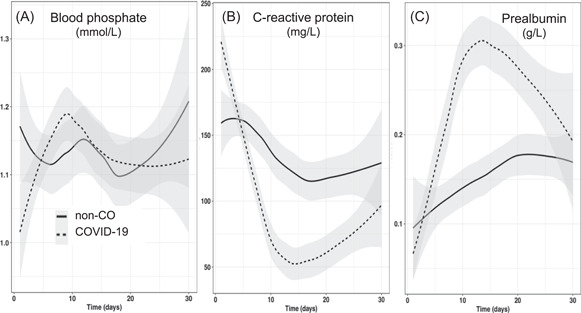
Figure 5.

Evolution of blood phosphate, C‐reactive protein, and prealbumin levels over time. Admission blood phosphate level (first 48 h) was significantly lower in the COVID‐19 group (0.96 mmol/L [0.86–1.14] vs 1.11 mmol/L [0.86–134]; P = 0.033), whereas C‐reactive protein level was significantly higher (196 mg/L [130–281] vs 108 mg/L [42–214]; P = 0.003). COVID‐19, coronavirus disease 2019
