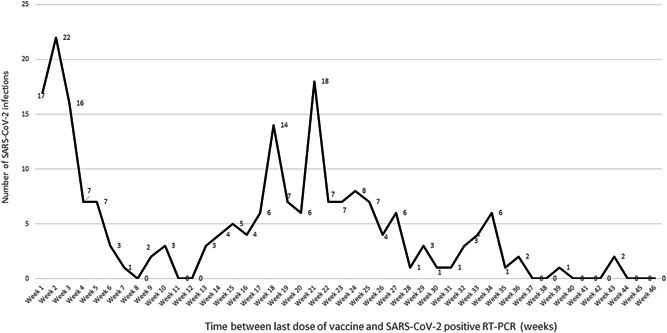
Figure 2.

Distribution of the numbers of severe acute respiratory syndrome coronavirus 2 (SARS‐CoV‐2) Omicron infections corresponding to vaccine breakthrough according to time following the last dose of anti‐SARS‐CoV‐2 vaccination. The graphic represents the distribution of diagnoses of SARS‐CoV‐2 infection with the Omicron variant corresponding to vaccine breakthrough according to the number of weeks following anti‐SARS‐CoV‐2 vaccination. The delay to infection was calculated as the difference between the time of the first positive SARS‐CoV‐2 qPCR and that of the vaccine dose (first to fourth dose) last received by the patient
