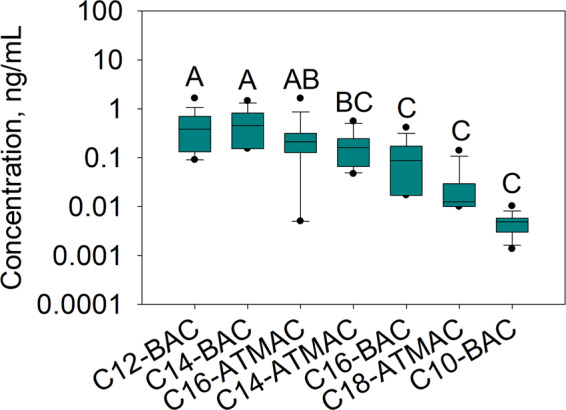
Fig. 1. Concentrations of QACs detected in more than 50% of the breast milk samples (ng/mL).

Concentrations are shown as box plots, representing the 25th and 75th percentiles; black lines represent the median and the whiskers represent the 10th and 90th percentiles; the dots represent the 5th and 95th percentiles. The letters show the results of the one-way analysis of variance (ANOVA) and the concentrations are ranked from the highest to the lowest in alphabetical order (A stands for the highest and C for the lowest). The concentrations sharing the same letter are not statistically different at p < 0.05 (e.g., C12-BAC, C14-BAC, and C16-ATMAC).
