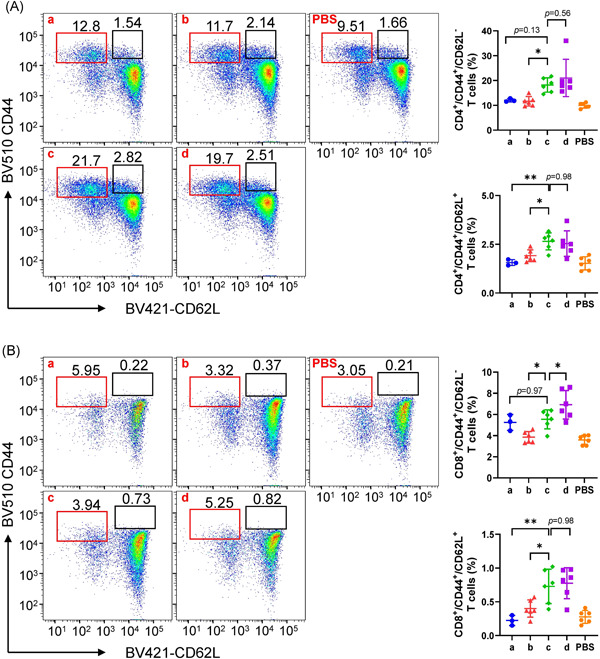
Figure 4.

CD4+ and CD8+ memory T cell analysis by flow cytometry. (A) CD4+ memory T cells. (B) CD8+ memory T cells. Pseudocolor images displaying representative results near the average value for gated CD44+/CD62L+ cells are listed in the left panels of (A) and (B). N = 6, points represent individual mice and three data points for which the cells clotted in the Group a were eliminated. Data are shown as the mean with standard deviation and were compared using one‐way analysis of variance followed by Dunnett's multiple comparisons tests, with Group c as the control. *p < 0.05; **p < 0.01. PBS, phosphate‐buffered saline
