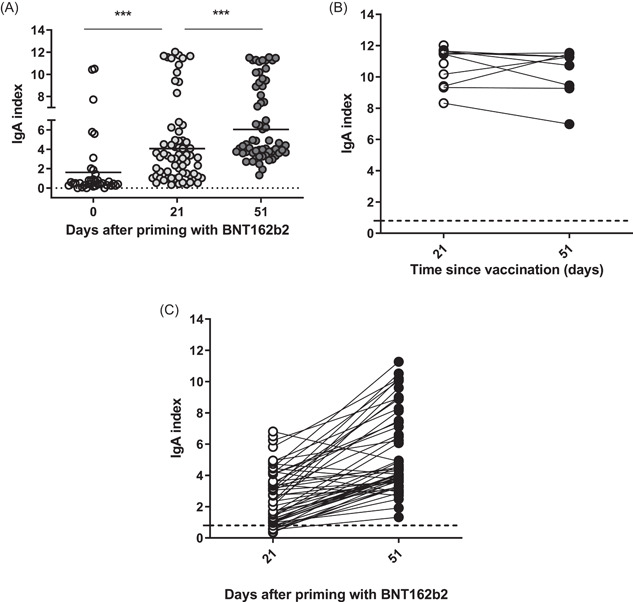
Figure 2.

Characteristics of virus‐specific IgA response induced with the mRNA vaccine. (A) Individual values of RBD‐binding IgA index on D0, D21, and D51. Means are denoted. Dotted line corresponds to the cut‐off level (0.8), ***p < 0.001. (B) Dynamics of individual RBD‐specific IgA responses in the subgroup with high IgA values on D21 to D51. (C) Dynamics of individual RBD‐specific IgA responses in the rest of the volunteers. IgA, immunoglobulin A; mRNA, messenger RNA; RBD, receptor‐binding domain
