
Figure 3.
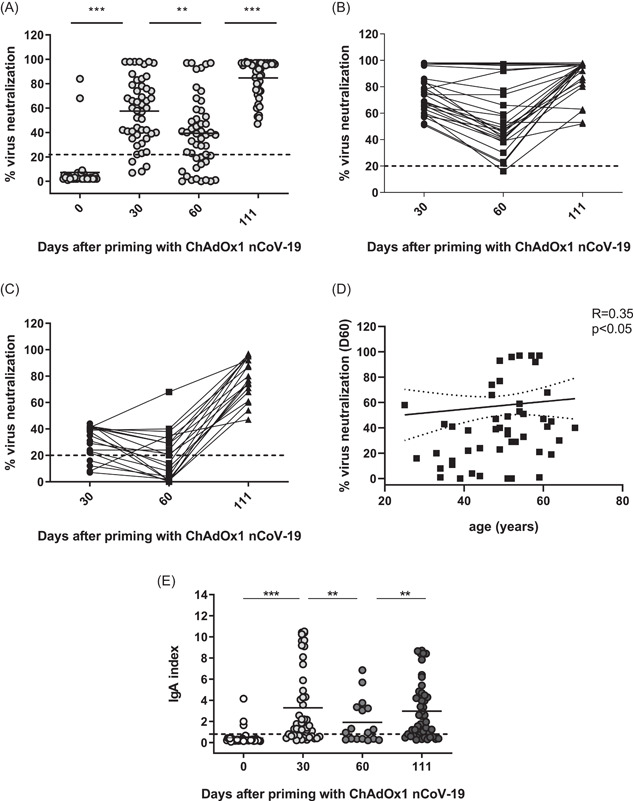
Characteristics of virus‐neutralizing activity (VNA) and virus‐specific IgA responses induced after immunization with vector vaccine. (A) Summarized data for VNA on D0, D30, D50, and D111 calculated as described in the Section 2 using the absorbance of the anti‐SARS‐CoV‐2 RBD‐blocking Abs. Dotted line corresponds to the cut‐off level (20%), **p < 0.01, ***p < 0.001. (B, C) Individual dynamics of responses in donors who had >50% and <50% VNA, respectively, on D30 to D111. (D) Correlation between the age of immunized and VNA on D60 after priming with vector vaccine. (E) Individual values of RBD‐binding IgA index on D0, D30, D60, and D111. Means are denoted. Dotted line corresponds to the cut‐off level (0.8). IgA, immunoglobulin A