Figure 4.

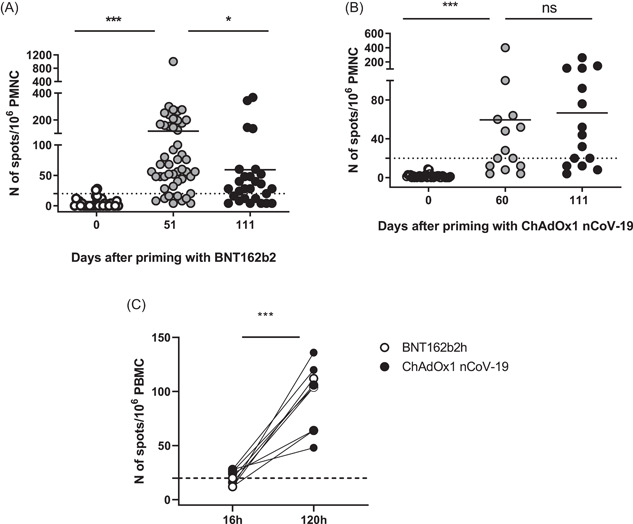
Postvaccinal SARS‐CoV‐2 specific cellular immune response. (A) Individual numbers of SFC on D0, D51, and D111 after immunization with mRNA vaccine, *p < 0.05, ***p < 0.001. (B) Individual numbers of SFC on D0, D60, and D111 after immunization with the vector vaccine, ns p > 0.05. (C) Comparison between the number of SFC after short‐term (16 h) and long‐term (120 h) stimulation with SARS‐CoV‐2 S peptide pool. Dotted lines correspond to the cut‐off level of the test (20 SFC/106 PBMC). mRNA, messenger RNA; PBMC, peripheral blood mononuclear cells
