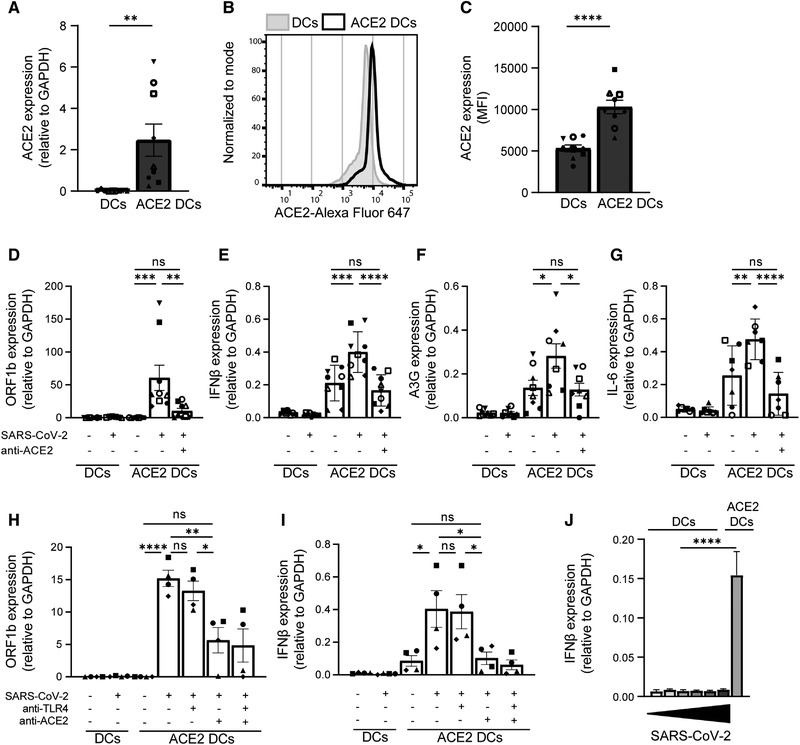
Figure 5.

Ectopic expression of ACE2 on DCs results in infection and induction of immune responses. (A‐C) Ectopic expression of ACE2 on primary DCs was determined by qPCR and flow cytometry. (A) Cumulative qPCR data of ACE2 expression on DCs. (B) Representative histogram of ACE2 expression on DCs. (C) Cumulative flow cytometry data of ACE2 expression. (D‐G) ACE2‐positive and ‐negative DCs were exposed to primary SARS‐CoV‐2 isolate in presence or absence of blocking antibodies against ACE2. Infection (D) and mRNA levels of IFN‐β (E), A3G (F), and IL‐6 (G) were determined with qPCR. (H‐I) ACE2‐positive and ‐negative DCs were exposed to primary SARS‐CoV‐2 isolate in presence of blocking antibodies against TLR4 and ACE2. Infection (H) and mRNA levels of IFN‐β (I) were determined with qPCR. (J) ACE2‐ negative DCs were exposed to increasing titers of primary SARS‐CoV‐2 isolate for 24 h and compared to ACE2‐positive DCs infected with TCID1000, and mRNA levels of IFN‐β were determined by qPCR. Increasing titers are indicated by a bar, ranging from TCID100 (narrow) to TCID100.000 (wide). Data show the mean values and SEM. Statistical analysis was performed using (A, C) unpaired student's t‐test or (D‐I) one‐way ANOVA with Tukey's multiple comparisons test. Data represent nine donors (A, C‐F) or seven donors (G) obtained in five separate experiments, or four donors (H‐J) obtained in two separate experiments, with each symbol representing a different donor. ****p < 0.0001; ***p < 0.001; **p < 0.01; *p < 0.05; MFI, mean fluorescence intensity; ns, nonsignificant.
