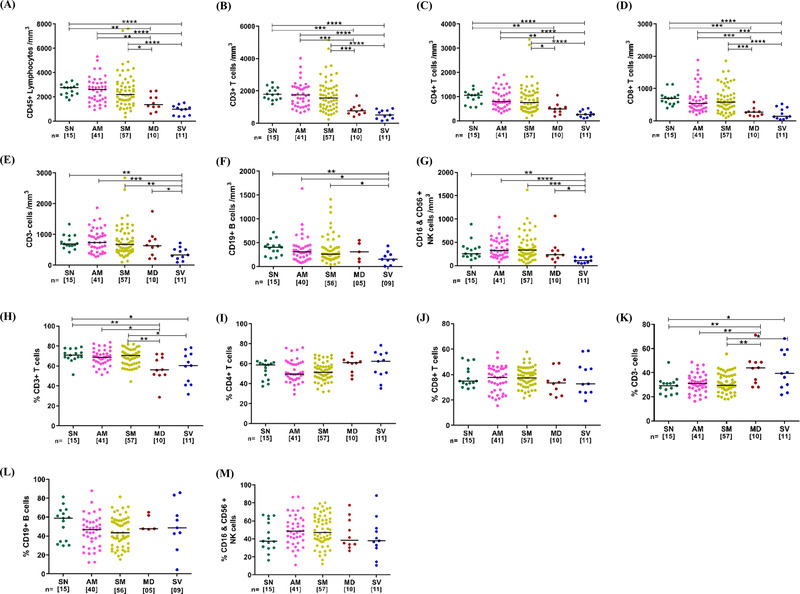
FIGURE 1.

Absolute numbers and frequency distribution of T lymphocytes, CD4+ and CD8+ T cells, Non‐T lymphocytes, B cells, and NK cells among study participants. (A‐G) Variation across seronegative (SN), asymptomatic mild (AM), symptomatic mild (SM), moderate (MD) and severe (SV) groups in counts of (A) CD45+ Total Lymphocytes (B) CD3+ T cells, (C) CD4+ T cells, (D) CD8+ T cells, (E) Non‐T lymphocytes (CD3‐ T cells), (F) CD19+ B cells and (G) CD16+& CD56+ NK cells. (H‐M) Variation across different study groups in frequency of (H) CD3+ T cells (I) CD4+ T cells (J) CD8+ T cells (K) CD3‐ T cells (L) CD19+ B cells and (M) CD16+& CD56+ NK cells. Statistical significance was calculated by non‐parametric one way ANOVA (Kruskal–Wallis test) followed by post hoc Dunn's‐test; *, p < 0.05; **, p < 0.01, ***,p < 0.001; and ****,p < 0.001
