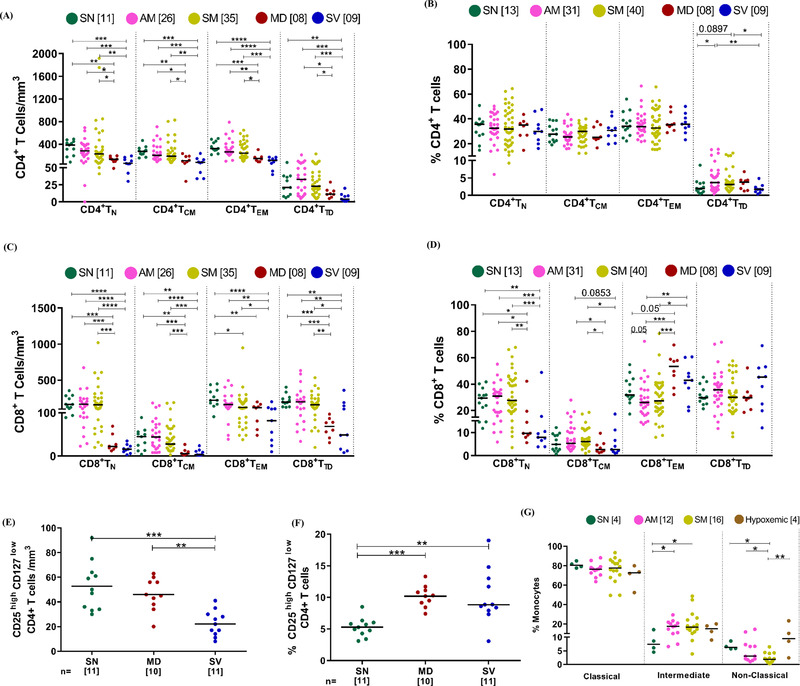
FIGURE 2.

Distribution of different immune subsets among study participants (A‐B) Variation across seronegative (SN), asymptomatic mild (AM), symptomatic mild (SM), moderate (MD), and severe (SV) groups in absolute count and frequency of CD4+ T cells subsets (N = Naïve, CM = central memory, EM = Effector Memory and TD = Terminally differentiated), respectively. (C‐D) Variation across different study groups in absolute count and frequency of CD8+ T cells subsets, respectively. (E‐F) Variation across different groups in Tregs count (E) and frequency(F). (G) Variation in frequency of monocyte subsets across different study groups. Statistical significance was calculated by non‐parametric one way ANOVA (Kruskal–Wallis test) followed by post hoc Dunn'stest; *, p < 0.05; **, p < 0.01, ***,p < 0.001; and ****,p< 0.001
