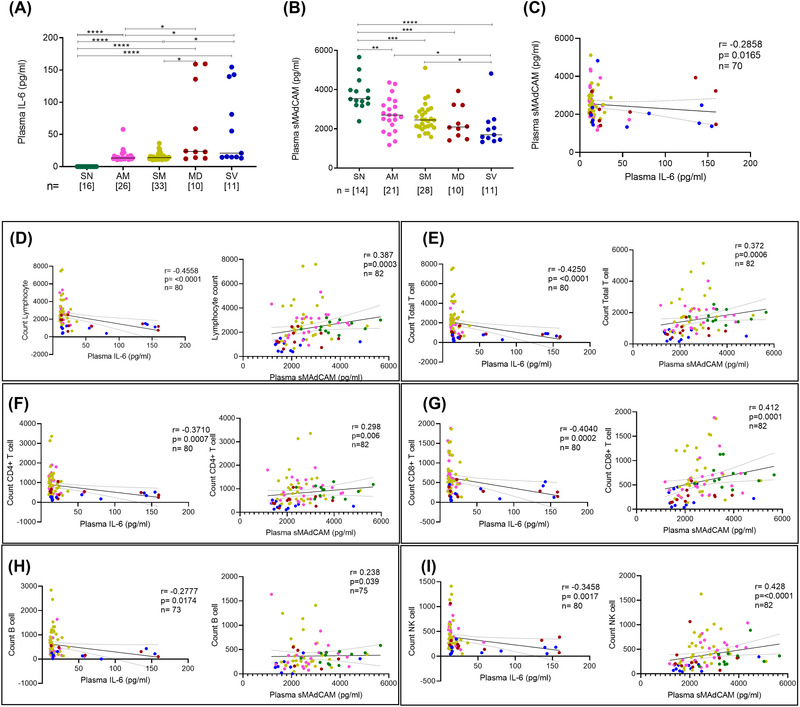
FIGURE 3.

Evaluation of IL‐6 and sMAdCAM along with correlation of cellular immune subsets in study participantsVariation in levels of (A) IL‐6 and (B) sMAdCAM in seronegative(SN), asymptomatic mild (AM), symptomatic mild (SM), moderate (MD) and severe (SV) groups. Relationship between (C) IL‐6 and sMAdCAM and their association with different cellular subsets (D) Lymphocyte count (E) Total T cell count (F) CD4+ T cell count (G) CD8+ T cell count (H) B cell count (I) NK cell count. Statistical significance was calculated by non‐parametric one‐way ANOVA (Kruskal–Wallis test) followed by post hoc Dunn'stest; *, p < 0.05; **, p < 0.01, ***,p< 0.001; and ****,p < 0.001. Correlation analysis was performed using non‐parametric Spearman Rank Correlation test
