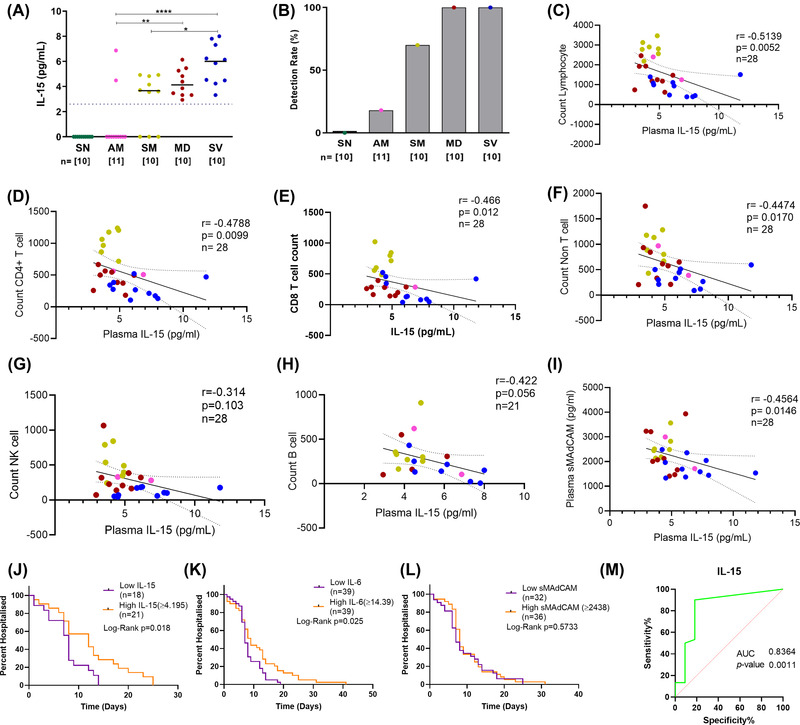
FIGURE 4.

Distribution of IL‐15 and its correlation with immune cells among study participants. (A) Variation in levels of IL‐15 in Seronegative (SN), asymptomatic mild (AM), symptomatic mild (SM), moderate (MD), and severe (SV) groups. The dotted line indicates the limit of detection. (B) Responder rate. Association of IL‐15 and with different cellular subsets (C) Lymphocyte count (D) Total T cell count (E) CD4+ T cell count (F) CD8+ T cell count (G) B cell count (H) NK cell count (I) Soluble MAdCAM. (J‐L) Kaplan Meier plots depicting hospitalization duration post recruitment associated with plasma levels of (J) IL‐15 (K) sMAdCAM and (L) IL‐6. Individuals were categorized into a low and a high group on the basis of median levels. (M) Receiver operating characteristic (ROC) curve analysis of IL‐15 level to discriminate between asymptomatic(AM) and symptomatic (SM, MD, and SV)COVID‐19 infected patients.Area under curve(AUC)0.8364; 95%CI 0.6716 to 1.000; P = 0.0011. Statistical significance was calculated by non‐parametric one‐way ANOVA (Kruskal–Wallis test) followed by post hoc Dunn'stest; *, p < 0.05; **, p < 0.01, ***,p < 0.001; and ****,p < 0.001. Correlation analysis was performed using the non‐parametric Spearman Rank Correlation test. For Kaplan Meier comparisons, Log‐rank (Mantel‐Cox) test was used
